
Download PDF >
Concerns are building
Across the developed world, private credit lending has exploded in size over the last 10–15 years, filling the gap left by direct bank lending over the same period and taking share from the high yield bond and leverage loan markets. While consistent and definitive market level data is difficult to find, we estimate that private credit average leverage ratios are much more extreme in the US and Europe (at more than 6x Debt to EBITDA), than Australia (at less than 4x). Our focus here is the US, however all else equal, the study is a reasonable proxy for the issues facing a similar cohort of European corporates.
While the seeming benevolence of private credit lenders has provided many small and medium-sized businesses with access to capital, it has also been instrumental in the commensurate growth of the high leveraged playbook of private equity. Importantly, this growth has occurred not in place of banks but has rather been supported by banks in the provision of both liquidity and capital markets linked
lending to the sector.
This boom was also well supported by the prevailing environment of low rates and largely benign economic conditions such that non-bank financial institutions now play a central and meaningful role in the US economy, comprising c.60%1 of financial assets.
Looking forward these operating models, leverage structures and interconnectedness with the banking system create a fault line in the otherwise exceptional US economy and create a risk to financial stability and growth, and is a risk that could be declared ‘obvious’ in hindsight.
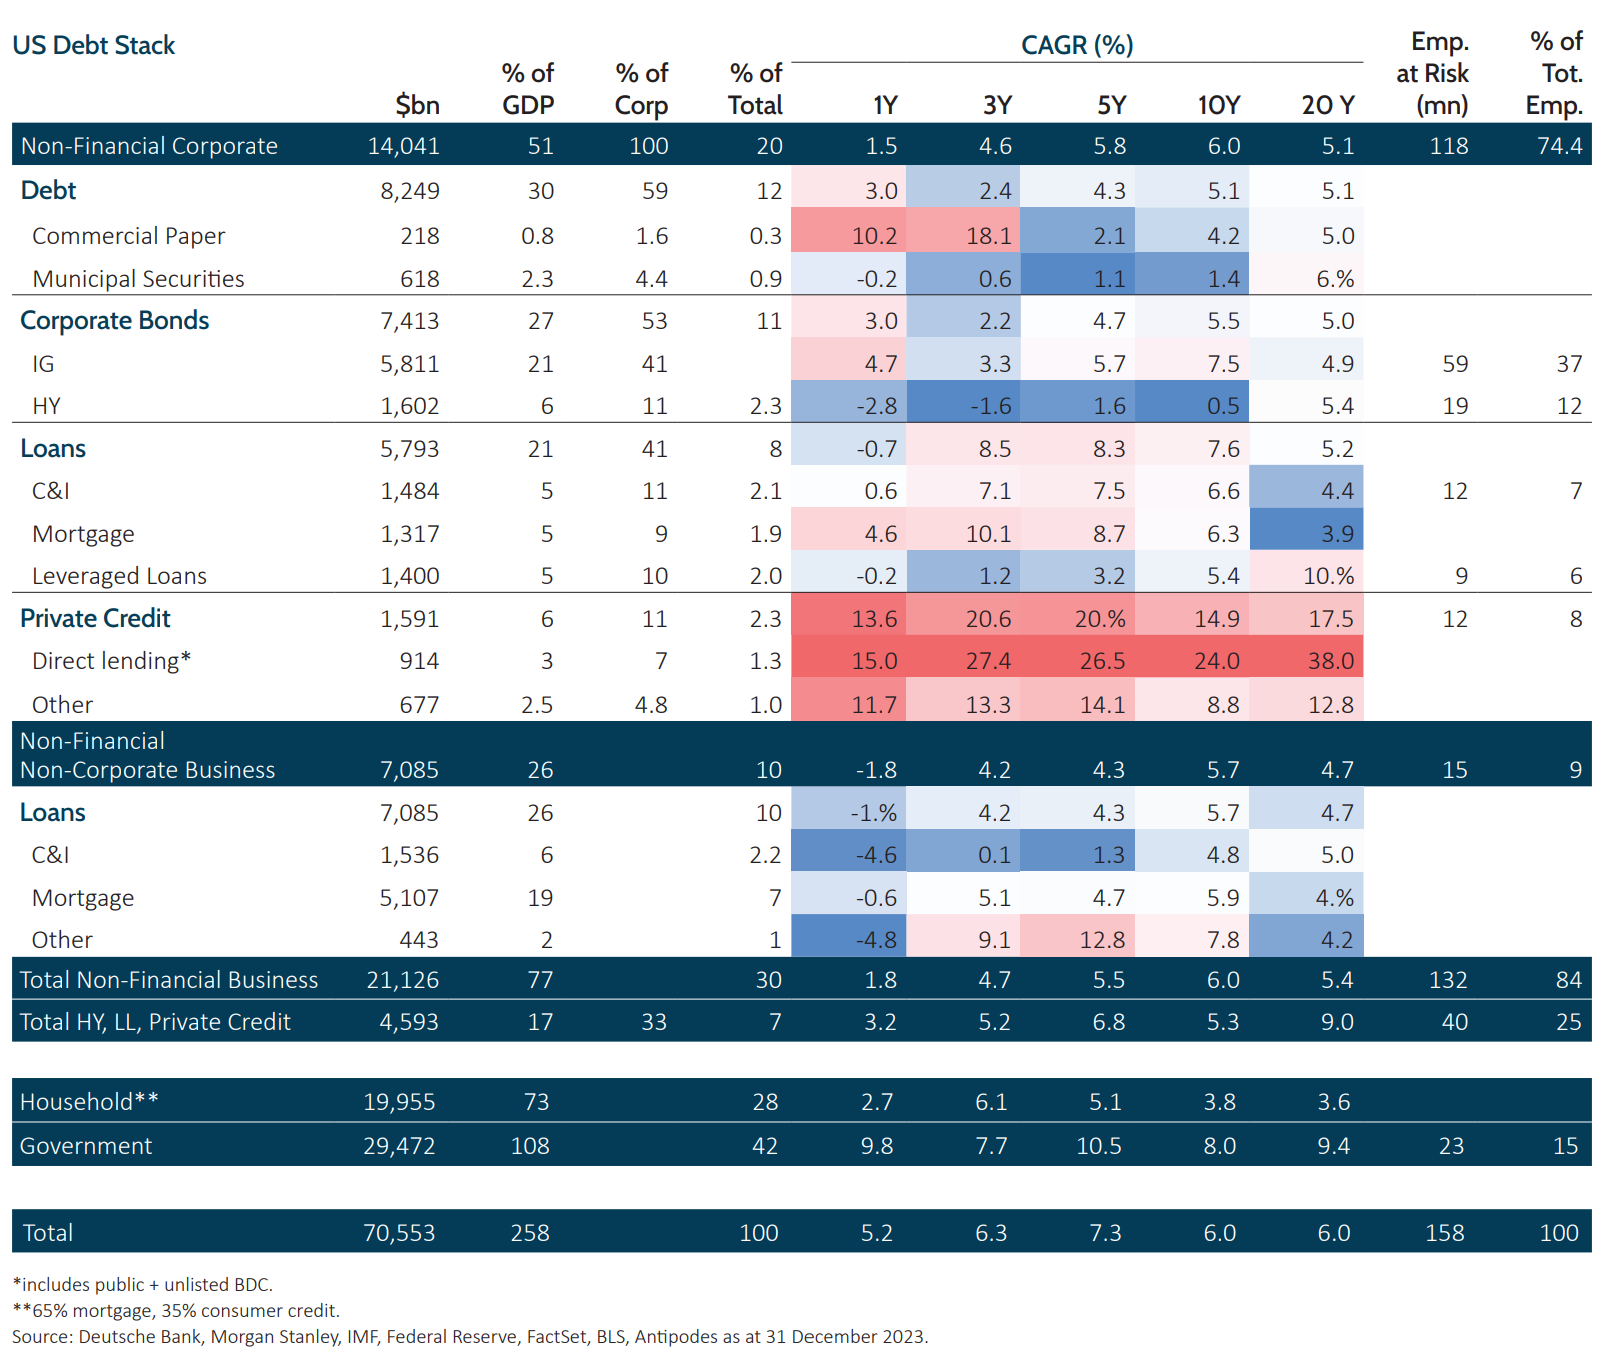
While not the sole area susceptible to higher rates, the repercussions of failures within companies that are highly leveraged apply broadly to both the real economy and financial markets. Firstly, these companies now support and have supported the outsized supply of growth capital to businesses across technology, retailing, healthcare and services and the aggregate of highly levered companies is estimated to employ more than 20% of the US workforce, whereby distress could spur a rise in the unemployment rate. Secondly, there are implications for the listed equities sector, as a lack of liquidity in private assets, creates the possibility of forced selling in the most liquid parts of end investors’ portfolios instead. Further, a withdrawal of banking sector support for private credit could perpetuate this fall in asset prices and broaden the repercussions of any shock.
As has been said many times before, more debt lowers resilience not only at a company level but for the whole economy.
Private credit is the fastest growing sector in credit markets
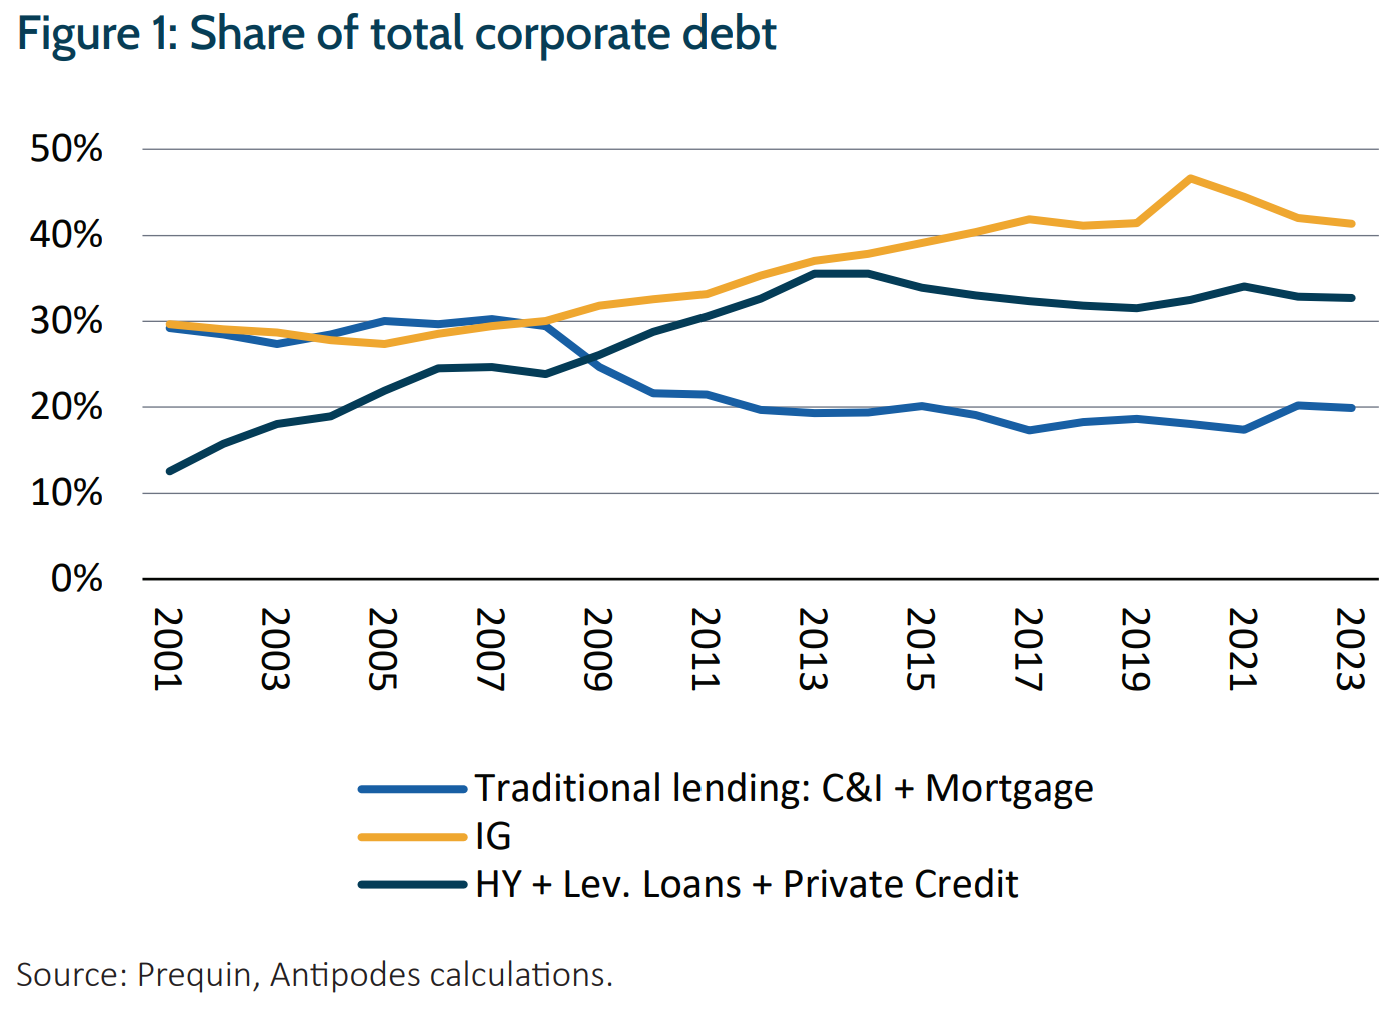
Private credit lending competes with the high yield bond and leverage loan markets, traditionally described as ‘junk’ borrowing in terms of credit quality (sub investment grade / BB and below). This cohort represents c. $4tn in lending which equates to c.27% of total corporate lending in the US today.
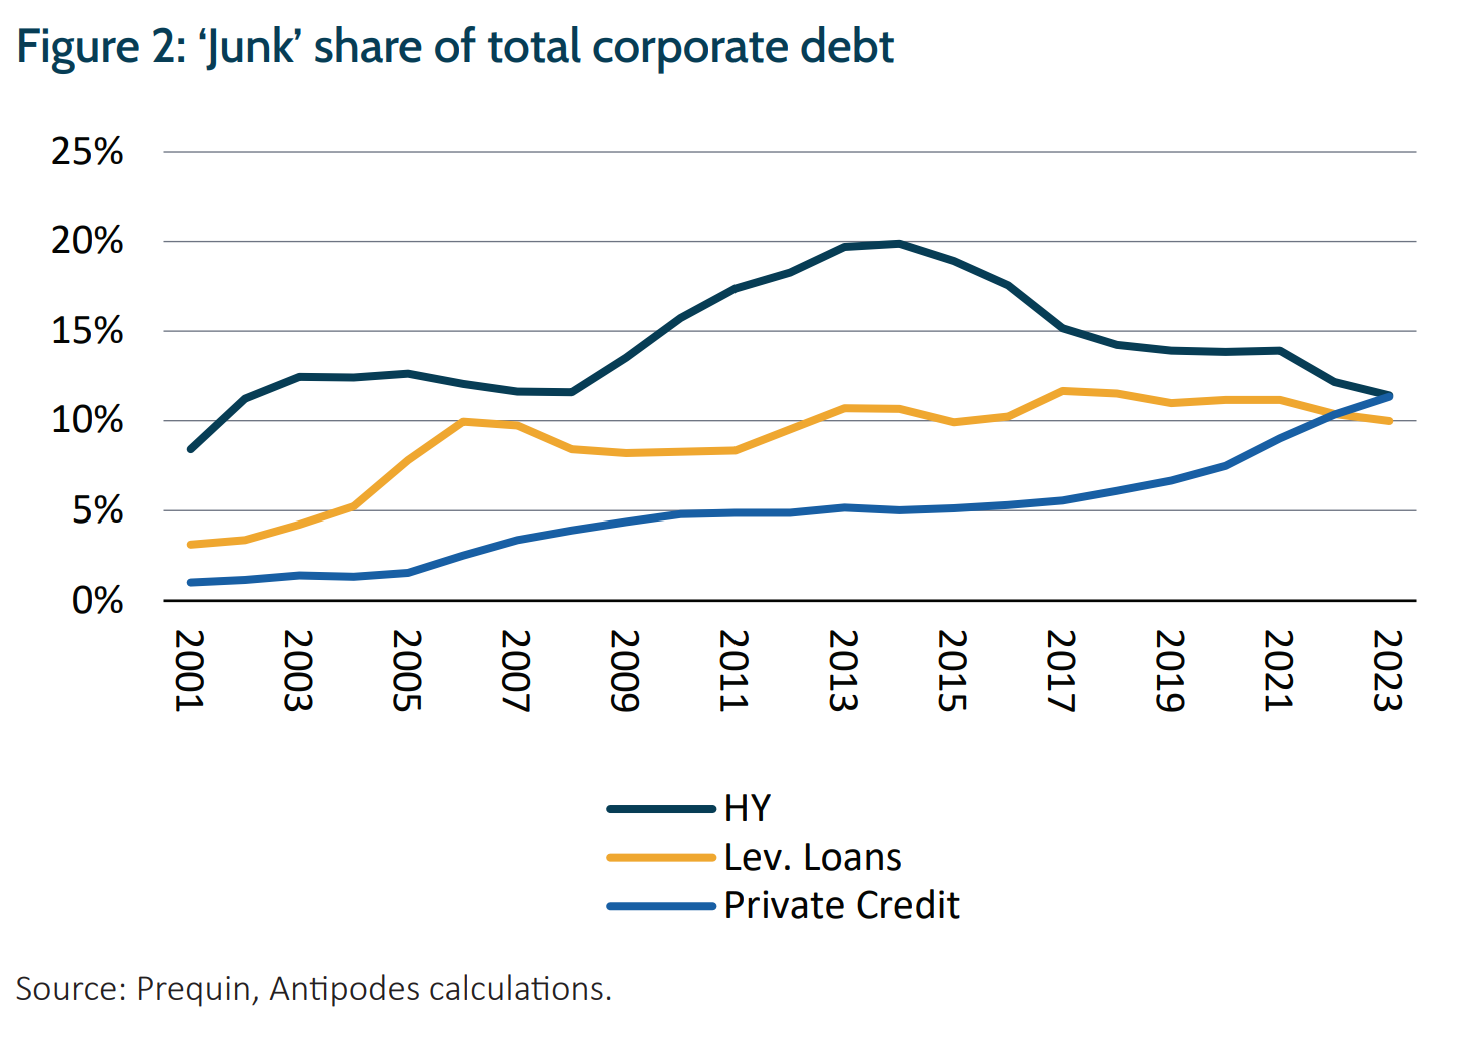
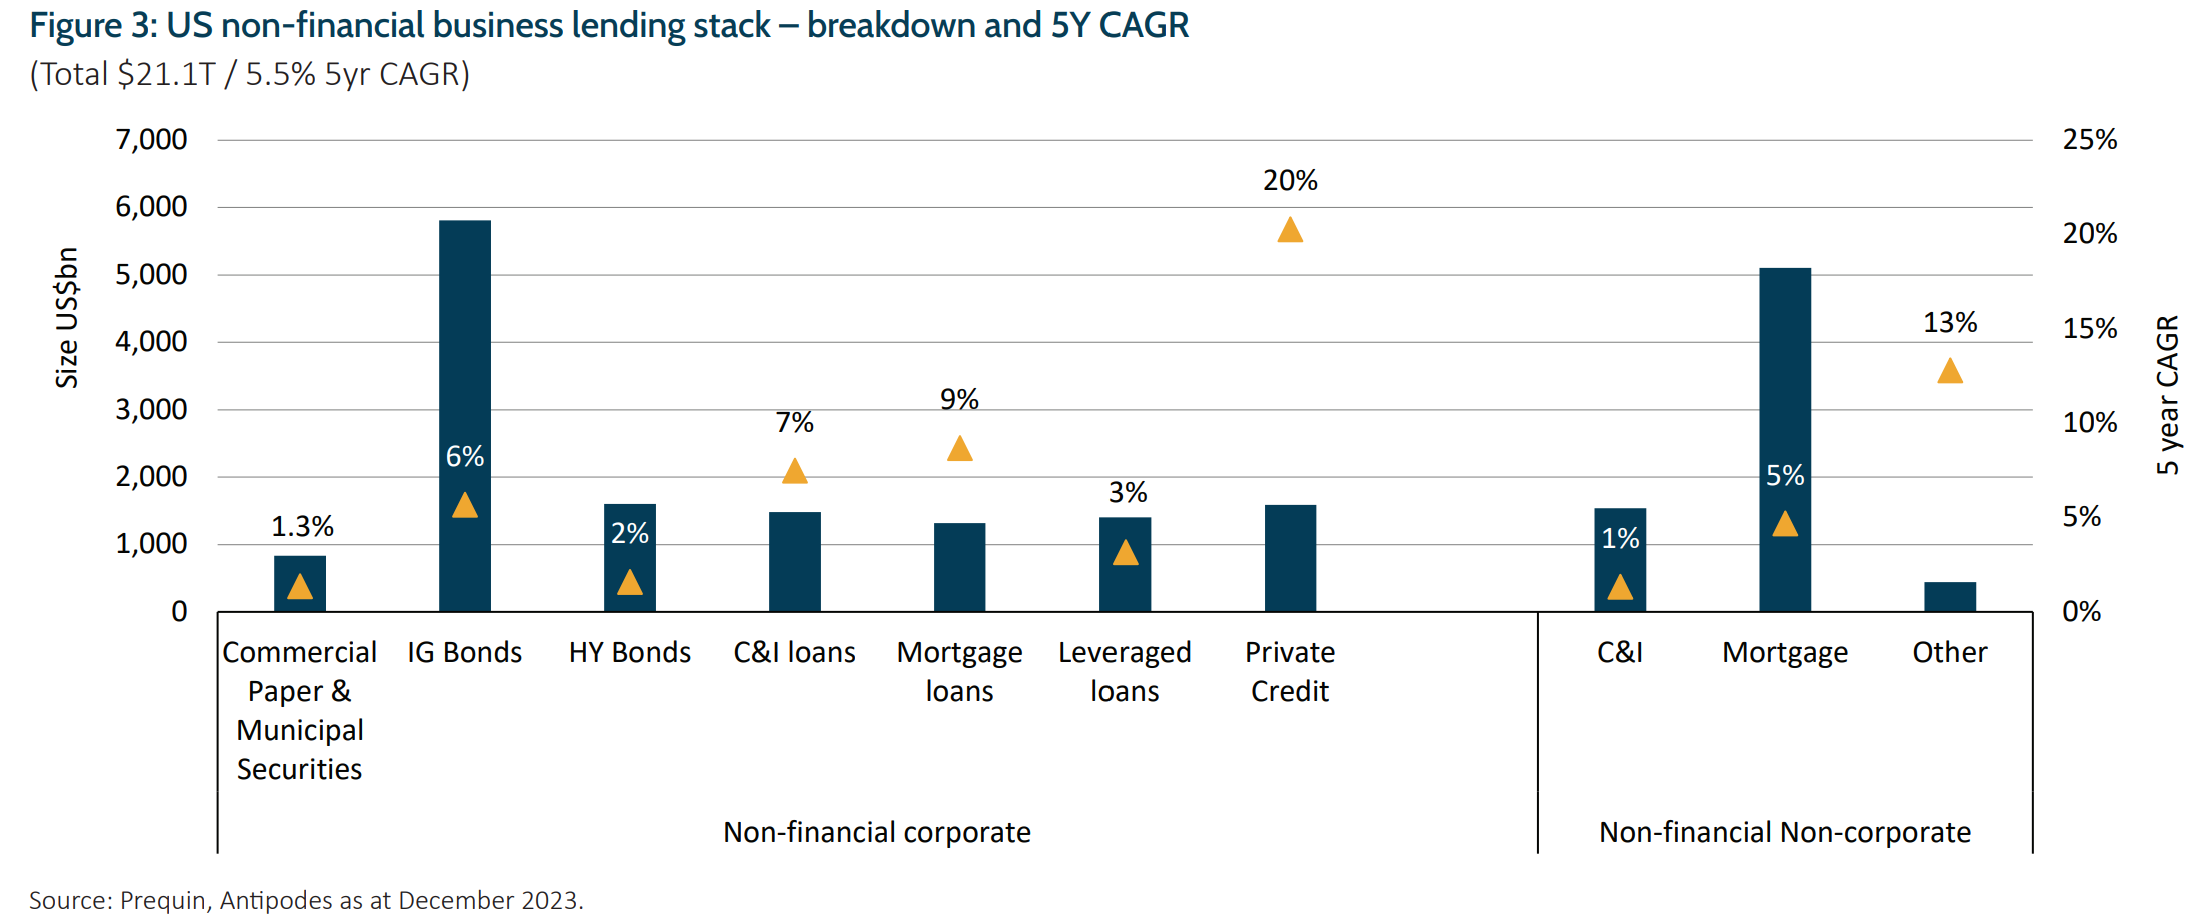
This ‘junk lending’ group collectively has taken share from traditional bank lending channels over time, where bank lending to these types of borrowers has declined since the Global Financial Crisis (GFC) due to tighter regulatory capital requirements and within this cohort, private credit has taken significant share growing rapidly at > 20% Compound Annual Growth Rate (CAGR) over the last five years to c.$1.6tn (see Figures 2–4). Within this, the direct lending component is $800bn2 (of which c.$300bn is more retail-oriented Business Development Corporations: BDCs). As this largely operates via multi-loan fund structures, the pools of capital are also leveraged with funding provided by both banks and capital markets.
By comparison, high yield has grown at a 1.6% CAGR to $1.6tn and leveraged loan lending at 3.2% CAGR to $1.4tn over the same period.
Higher risk than public credit
While each component within junk is now of similar size, the underlying characteristics differ with private credit borrowers generally smaller and more leveraged than their public market peers. Over the last five years we have seen a material proportion of higher risk/lower rated public credit borrowers turn to private credit lenders.
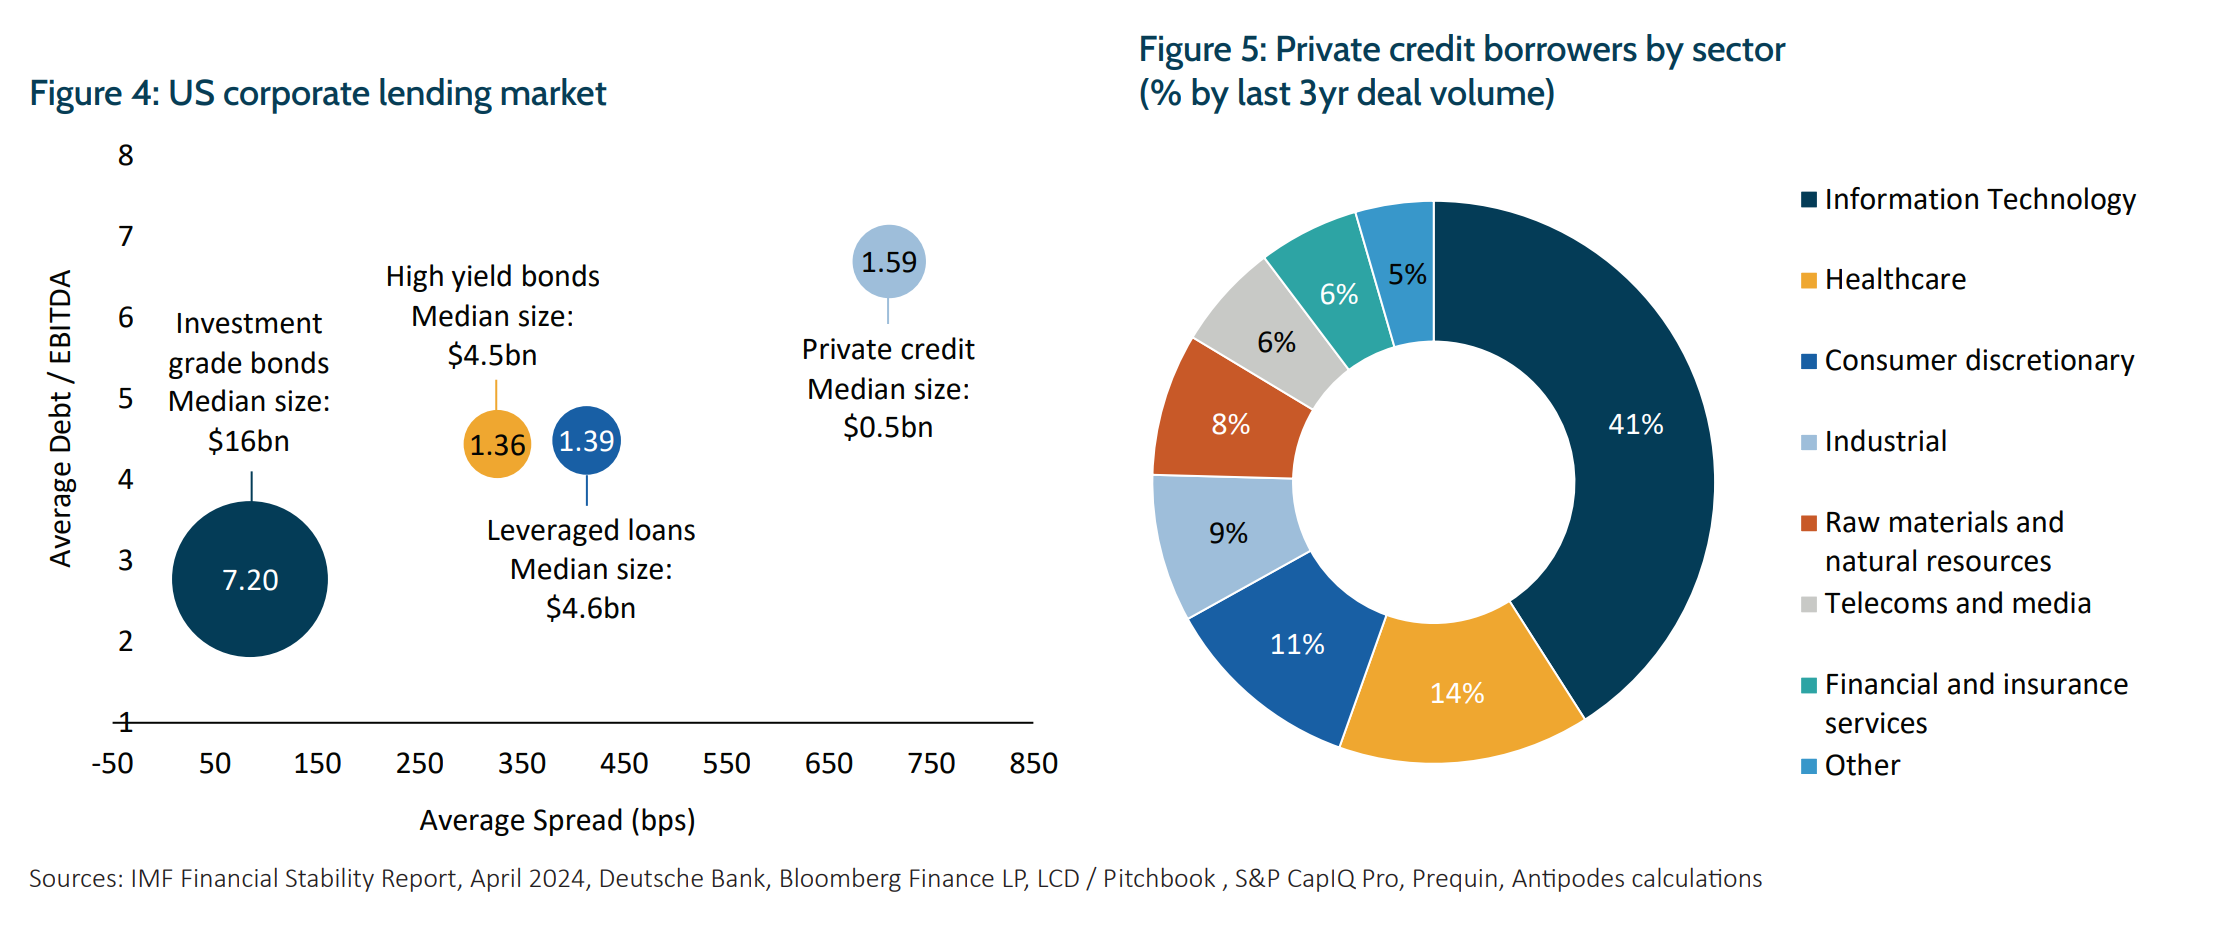
In general, private credit tends to have a smaller borrower size and far lower average loan size than high yield and leveraged loans. Also notable is that the leverage within these end companies, averaging 6.7x Debt to EBITDA is higher than the averages of 4.5x in the high yield and leveraged loan segments (see Figure 4). The differential between public and private credit spreads, needs to reflect this additional credit risk as well as an illiquidity premium. Whilst Direct Lending spreads of ~700bps above benchmark rates are higher than leveraged loans spreads of ~400bps, we caution that both credit risk and illiquidity likely mean that private credit investors are simply taking more risk than public credit investors. The true level of alpha generated by the asset class may only be measurable when the credit cycle turns, and default rates increase. Importantly, the higher absolute interest burden for private credit borrowers has increased significantly in this rate hiking cycle to >12% on average.
Further, a significant portion of lending in this highly geared segment of the market is sponsor backed, meaning by private equity capital. The International Monetary Fund (IMF) estimates that 72% of private credit lending within the US is to private equity backed companies. Adding private equity borrowing within the high yield and leveraged loan market takes the participation of private equity borrowing in that market to >$2tn, that is ~60% of the junk lending market is to companies backed by a private equity sponsor.
This is overwhelmingly skewed to the information technology sector, which has also seen rapid growth co-incident with that of the private equity and private credit sectors, though healthcare and consumer discretionary sectors are also material in exposure (Figure 5).
While the ability of the ‘sponsor’ private equity funds to tip in additional equity is often lauded as a derisking factor in favour of these borrowers, the reality is that the same Private Equity (PE) teams that negotiate favourable debt terms also pursue restructuring in favour of their investors when the debt turns sour. PE funds are more likely to pursue aggressive debt restructuring or simply walk away when the return profile is no longer in their favour.
What this highlights is that a significant portion of credit that previously resided on bank balance sheets, backed by capital and regulatory oversight, now resides in relatively opaque, bespoke and sequential private structures. Though sequential pools of private credit funds fulfill the relevant purpose of providing liquidity, as new funds can buy loans from older funds thereby creating liquidity, the risk becomes a scenario where persistent inflows reverse, thereby disrupting this mechanism and the capital is called. While banks do also provide debt and liquidity to the sector, this may also be curtailed in a scenario where defaults are rising, and liquidity becomes scarcer.
A notable point in direct lending (versus high yield/leveraged loans), is that private credit facilities usually contain bilaterally negotiated documents, covenants, and pricing. Technically this provides the private lender flexibility to manage through any credit issues.
In practice, documentation strength varies considerably amongst individual facilities, and documents have been getting weaker as private lenders have had to deploy the vast amount of capital being raised. While documentation strength is important, it is not a substitute for higher underlying credit quality, particularly if investors are incentivised to ‘kick-the-can down the road’. The incentives for private credit providers to preserve investor capital, rather than avoid embarrassment will drive much of the behaviour in the event of financial distress.
Credit quality deteriorating
As outlined above, currently we have a set-up where a large proportion of corporate lending is to businesses with a significant amount of leverage and where the cost of servicing these loans has escalated materially over the last two years. Accordingly, it is in the riskier tail where cracks may appear, with higher rates having led to delinquency and interest coverage deteriorating across all debt profiles.
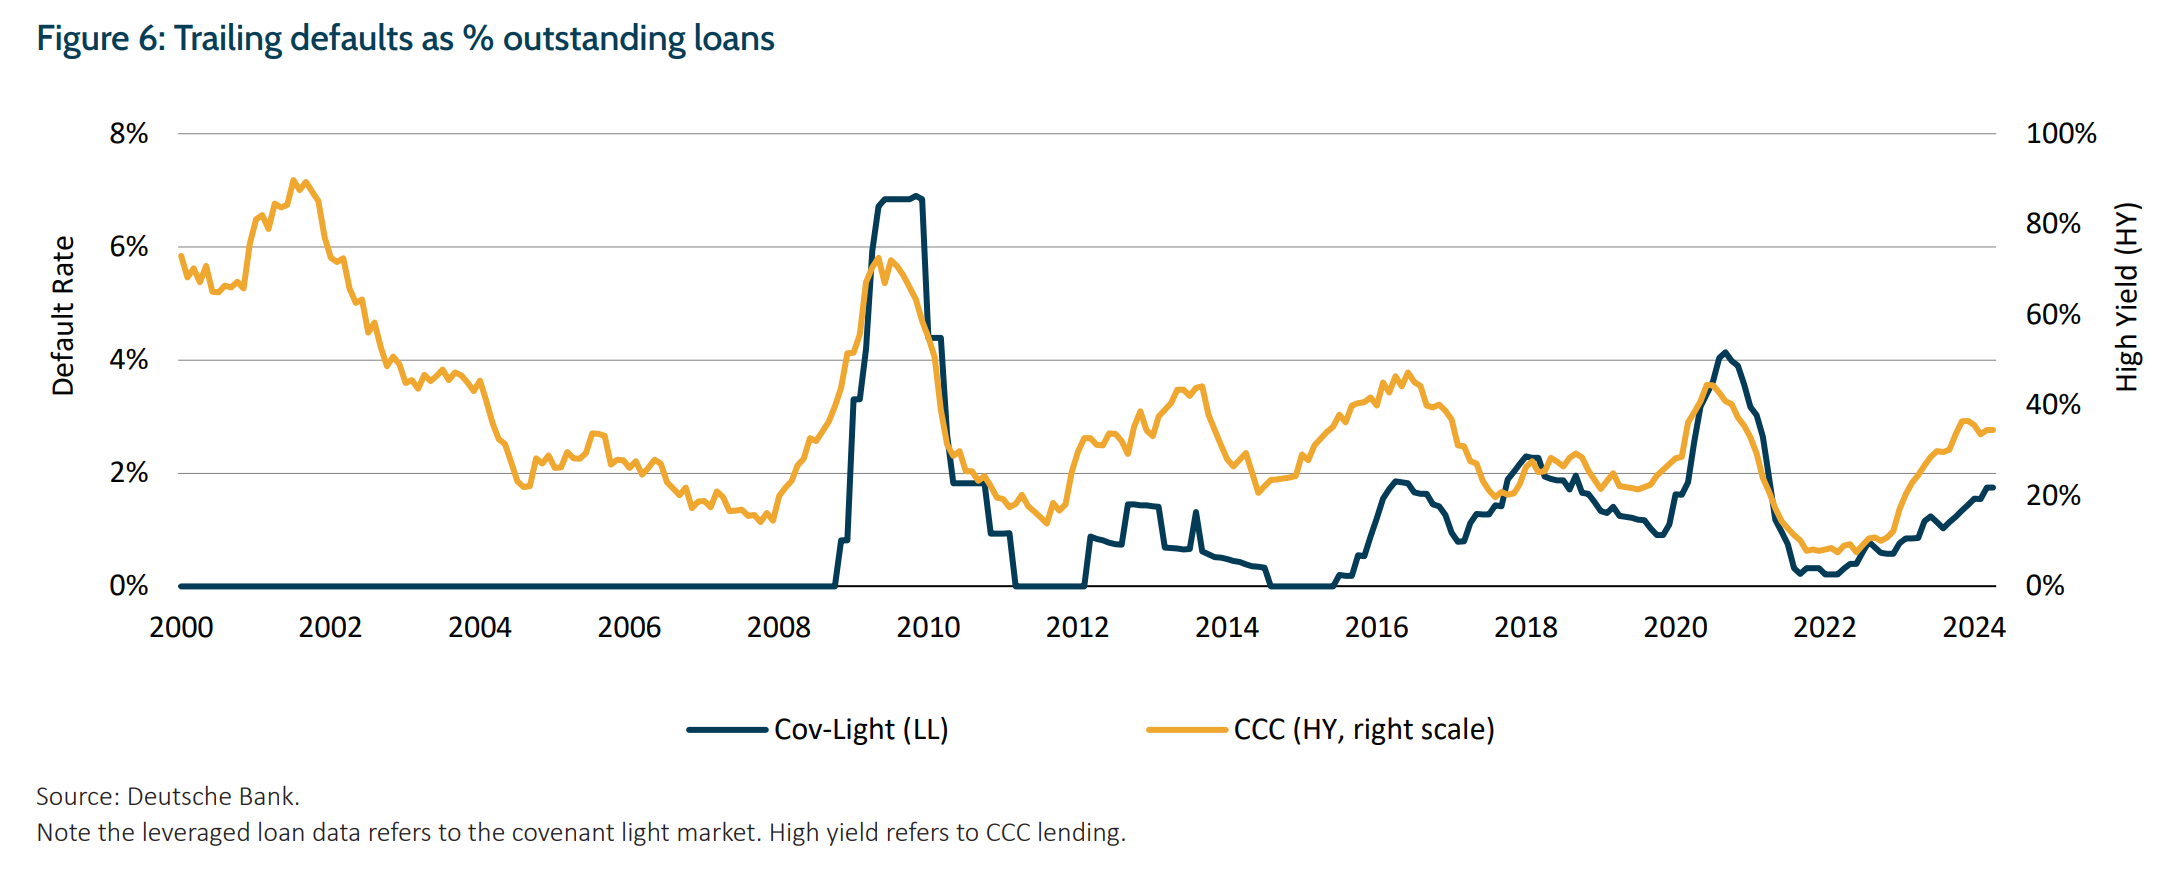
High yield and leveraged loans have a stronger starting position than private credit with interest coverage ratios in the 4–5x range. Both are seeing higher default rates as higher interest rates persist (Figure 6).
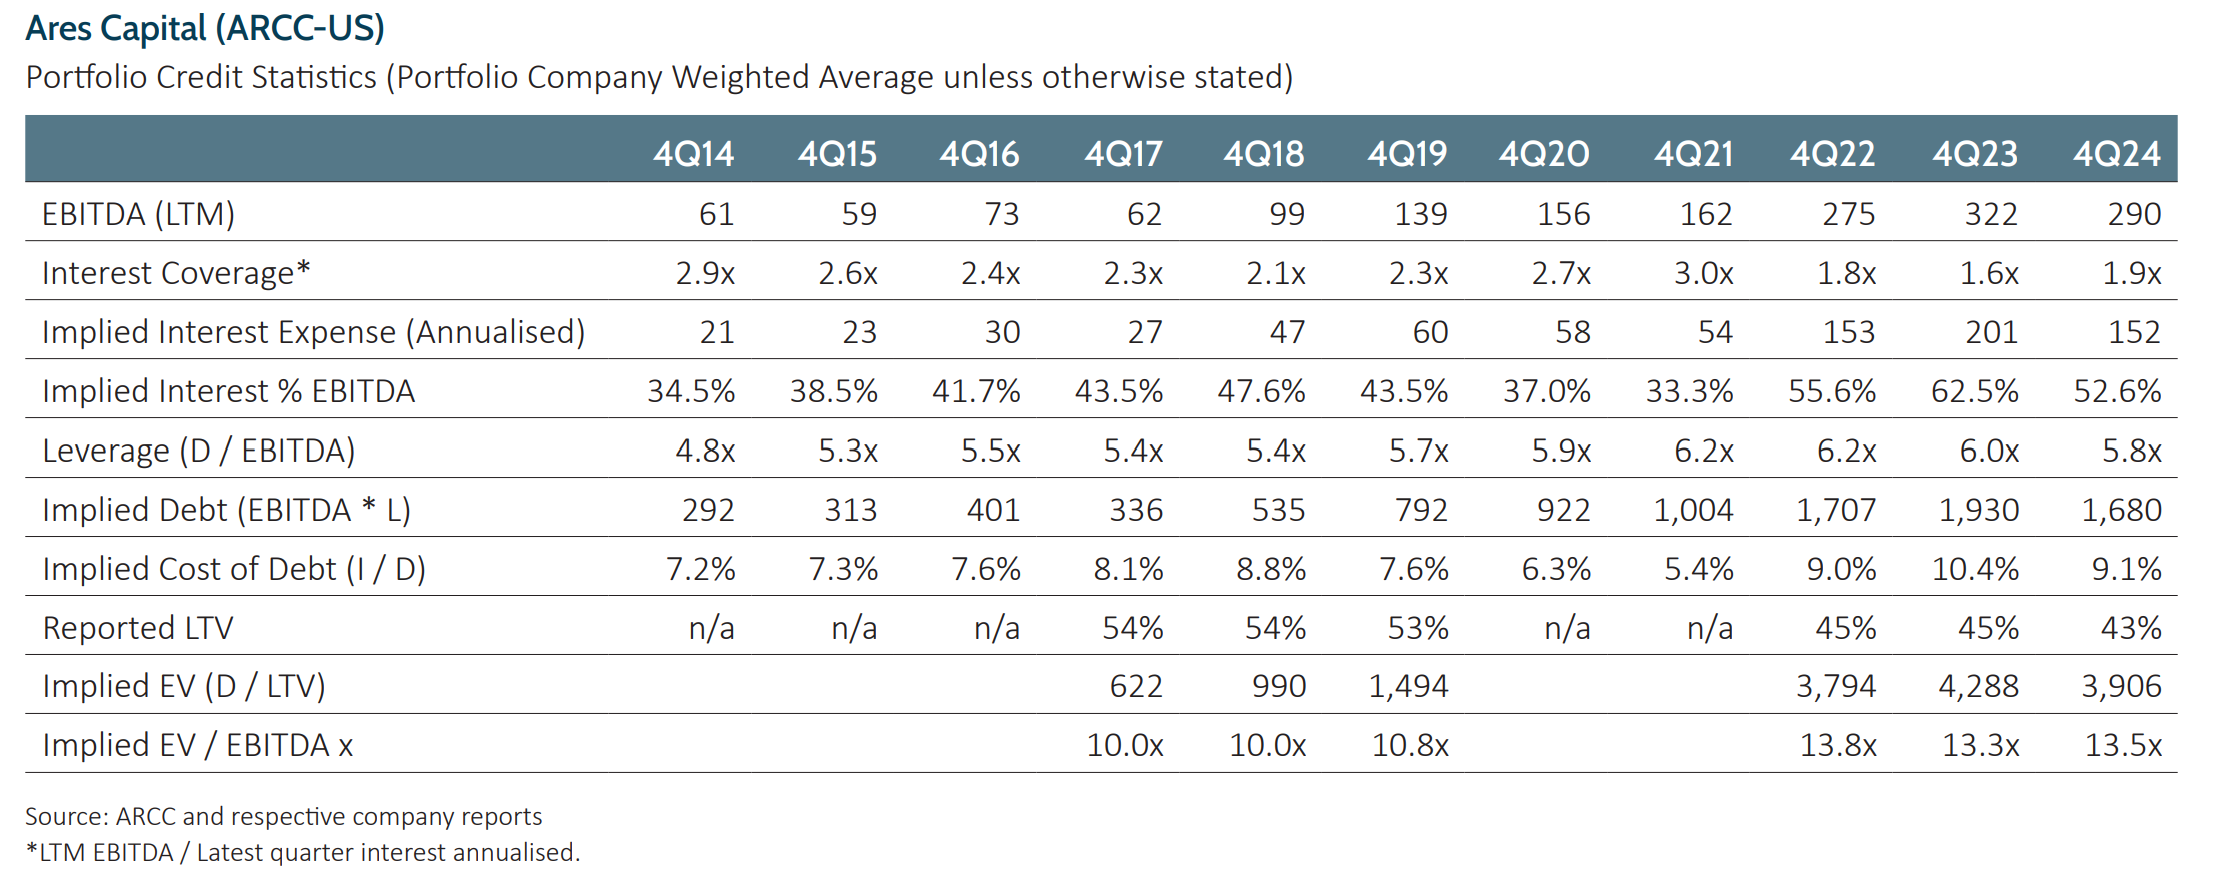
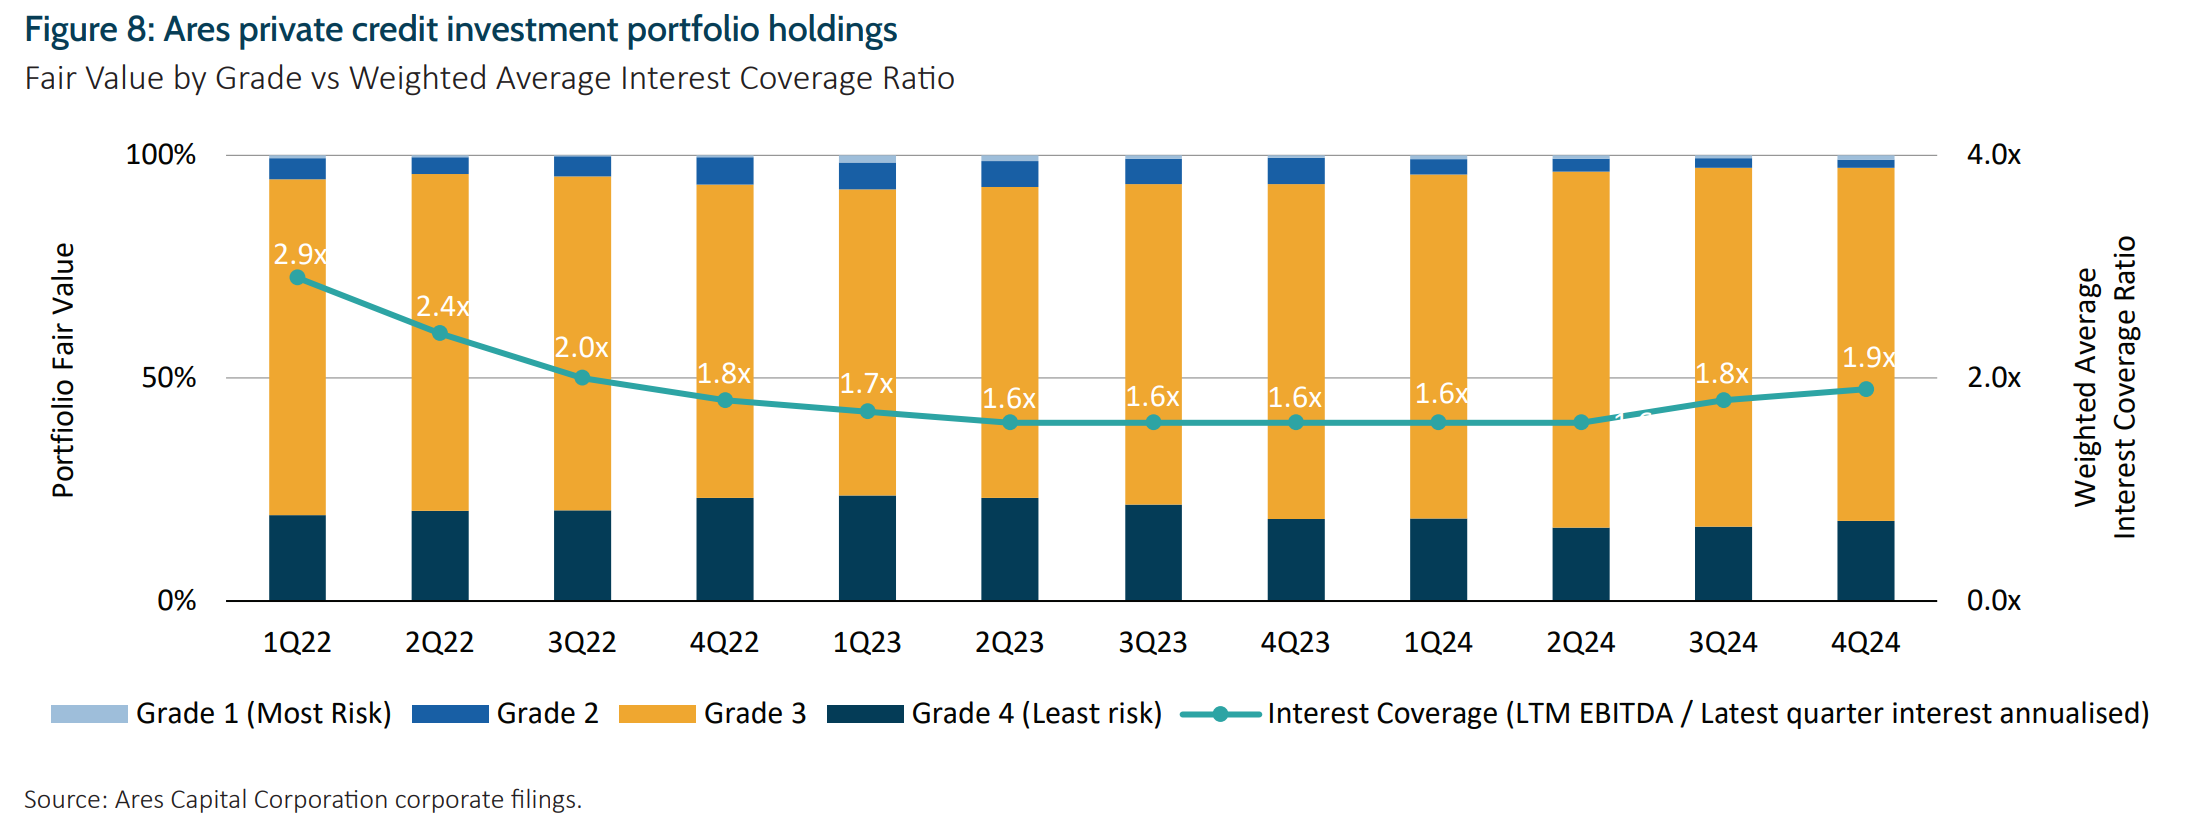
Private credit is, by definition, relatively scarce on public data, however we can glean insights from the required disclosures of Business Development Companies (BDC) structures, a $300bn market, representing c.9% of all private credit lending. Ares Capital Corporation is the largest listed BDC by market capitalisation. The table below shows that for the average corporate borrower within the structure, interest coverage at the EBITDA level has almost halved to a thin 1.6x over the past two years as average servicing costs have increased to 10.6%. This is consistent with October 2024 IMF data suggesting the average interest coverage ratio across all US BDCs was c.1.5x.
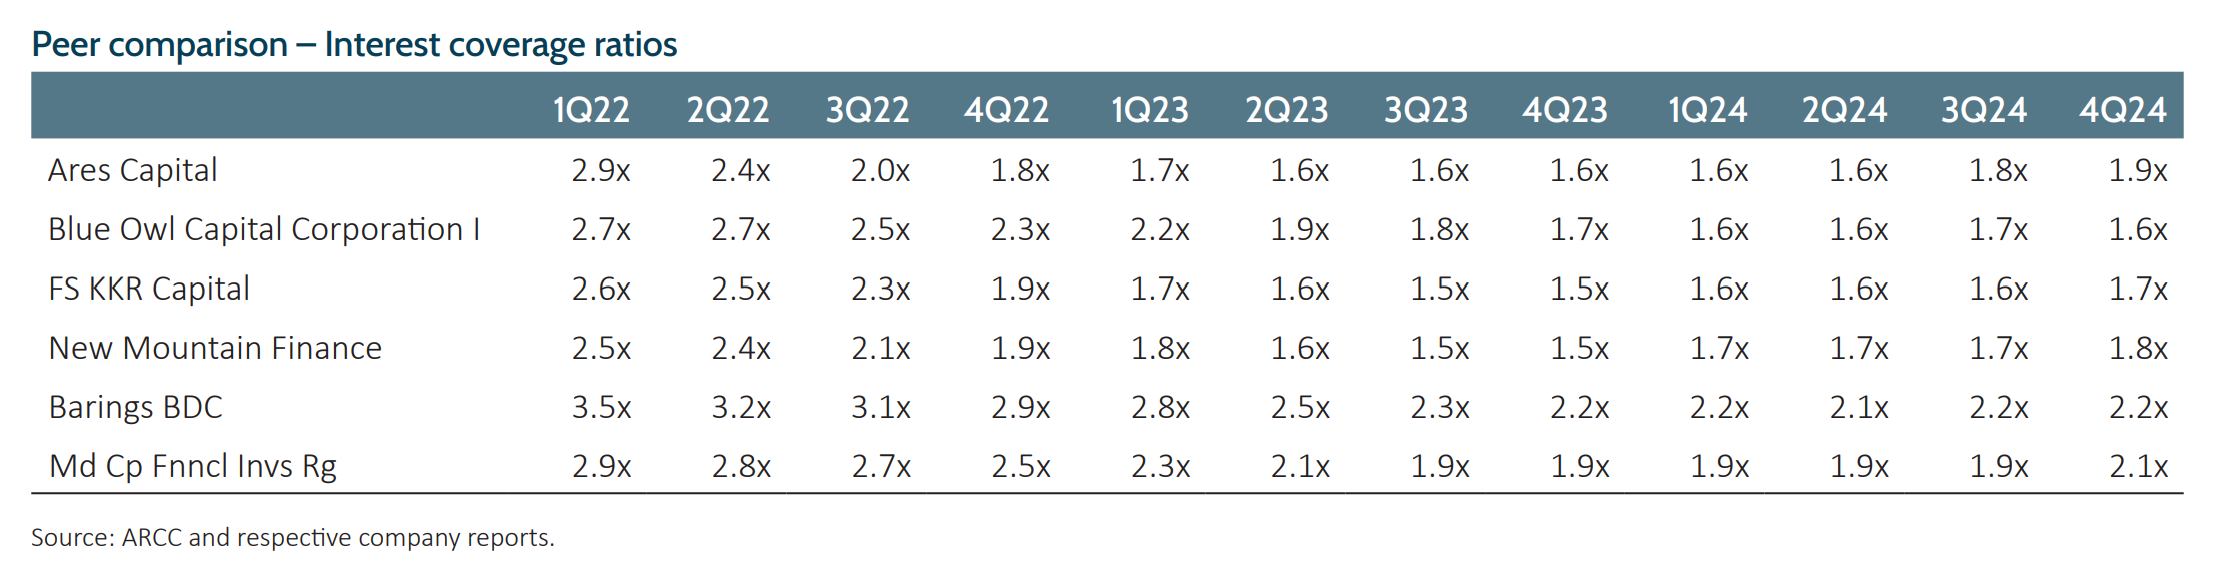
We consider this broadly representative of the market in terms of trend, though we expect this structure is likely to be better quality, with ‘scale’ enabling better underwriting with preferred access to larger and better-quality deals. Further, where data is available for other listed BDC peers, a similar trend is observed in terms of interest coverage.
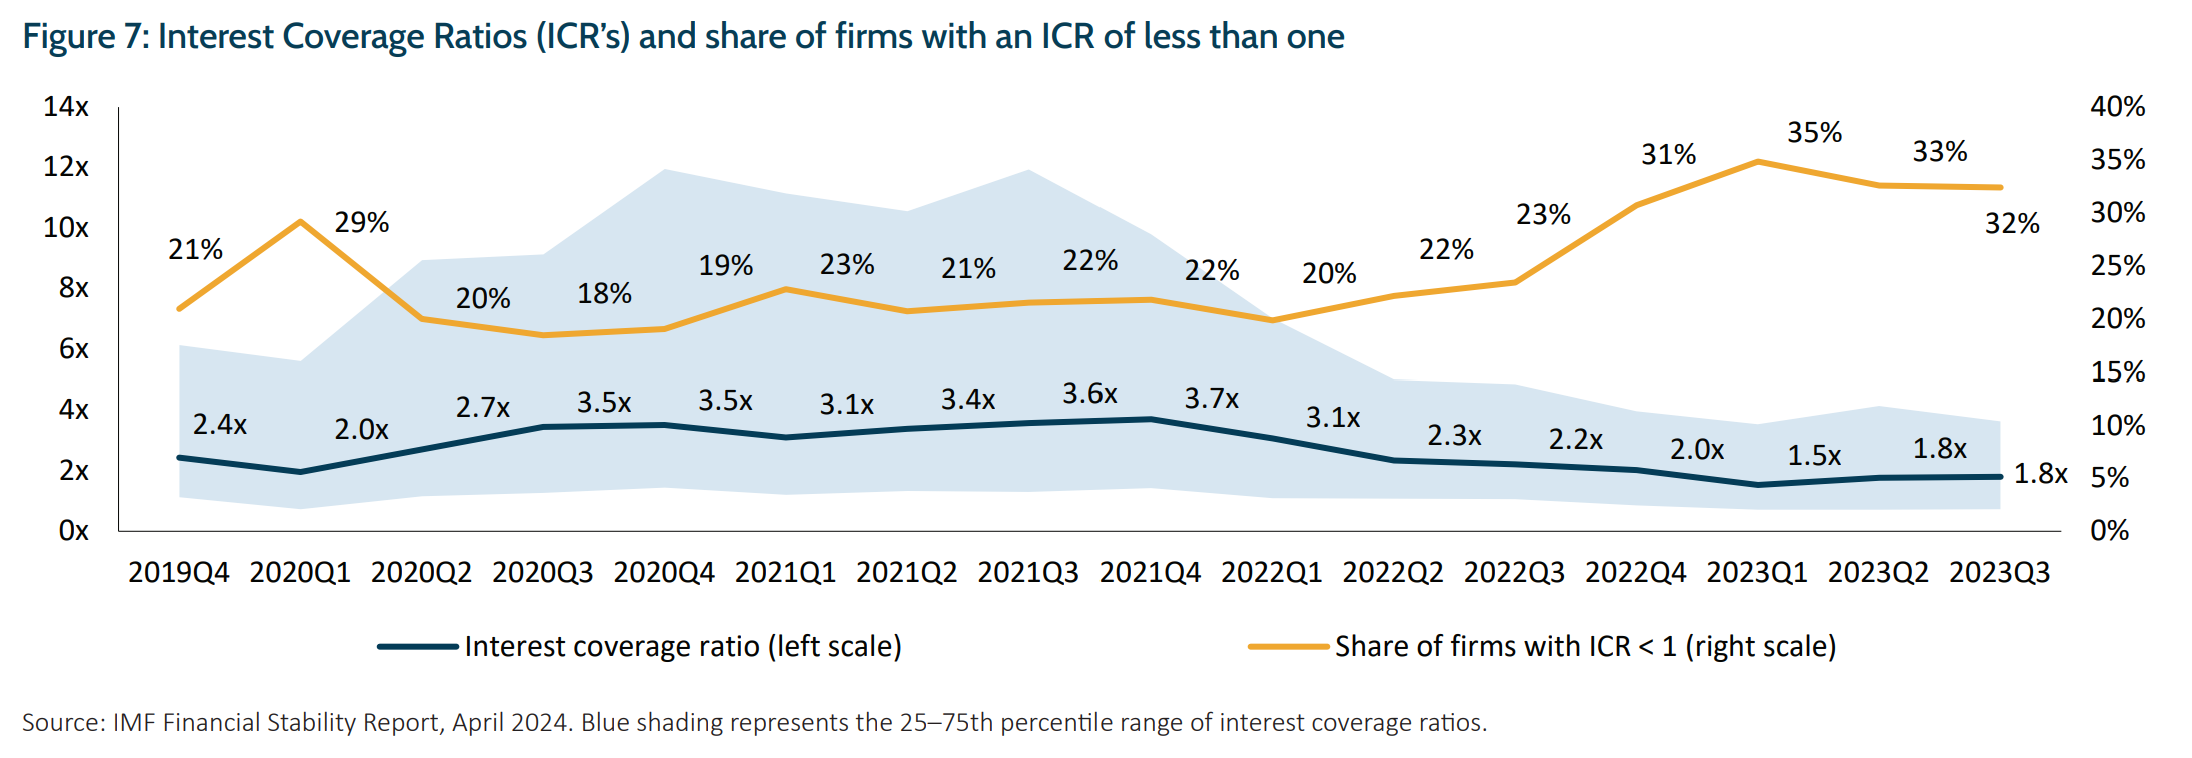
The deterioration in interest coverage and the ability to pay interest among BDCs is also mirrored in public firms with size and leverage characteristics like private credit, with median interest coverage ratios in the sample deteriorating from 3.1x to 1.8x.
Actual outcomes, however, will not only be dependent on the average (which may look elevated though manageable), but more importantly the distribution around the average and especially how fat the left-tail is.
We know from the Ares data above that the average interest cost as a percentage of EBITDA is >60% however if we extrapolate that the distribution of firms in private credit has followed a similar pattern to those comparable public firms, then a significant portion (see Figure 7. ~32%) now have interest coverage ratios of <1x. These firms are under severe stress and no longer have sufficient ‘adjusted EBITDA’ to cover interest, and cash flow is negative. Deducting required capital expenditure (a real cash flow item) would further result in a significant proportion of these companies being cash flow negative. While the analysis is to the end of 2023, it is unlikely these statistics have since moved in a favourable direction.
Additionally, total debt increased for these companies, suggesting on average, they have taken on alternative, incremental debt in order to cover costs, including interest costs. We view this to be an unsustainable scenario outside of interest rate or fixed costs cuts. Despite this, BDCs have reported minimal change in their portfolio risk, based on internal risk classifications for loans (see Figure 8).
Borrower stress can also be assessed through payments-in-kind (PIK) data where lenders accrue interest to the balance of the loan instead of taking a cash interest payment from the borrower. This is typically offered on loans of liquidity constrained borrowers (such as those with inadequate or negative cash flows) to avoid default.
Terms of PIK can vary greatly, ranging from a cessation in payment through to partial payments activated under predetermined conditions. PIK interest payments have surged for BDC portfolios. We estimate that >20% of BDC loans have payment-in-kind features as of 4Q23, and we may be on the cusp of increasing negotiation of payment terms of this nature if credit conditions remain tight or economic conditions deteriorate. Indeed, the IMF Financial Stability report data from October 2024 suggests that PIK income share have further increased in 2024.
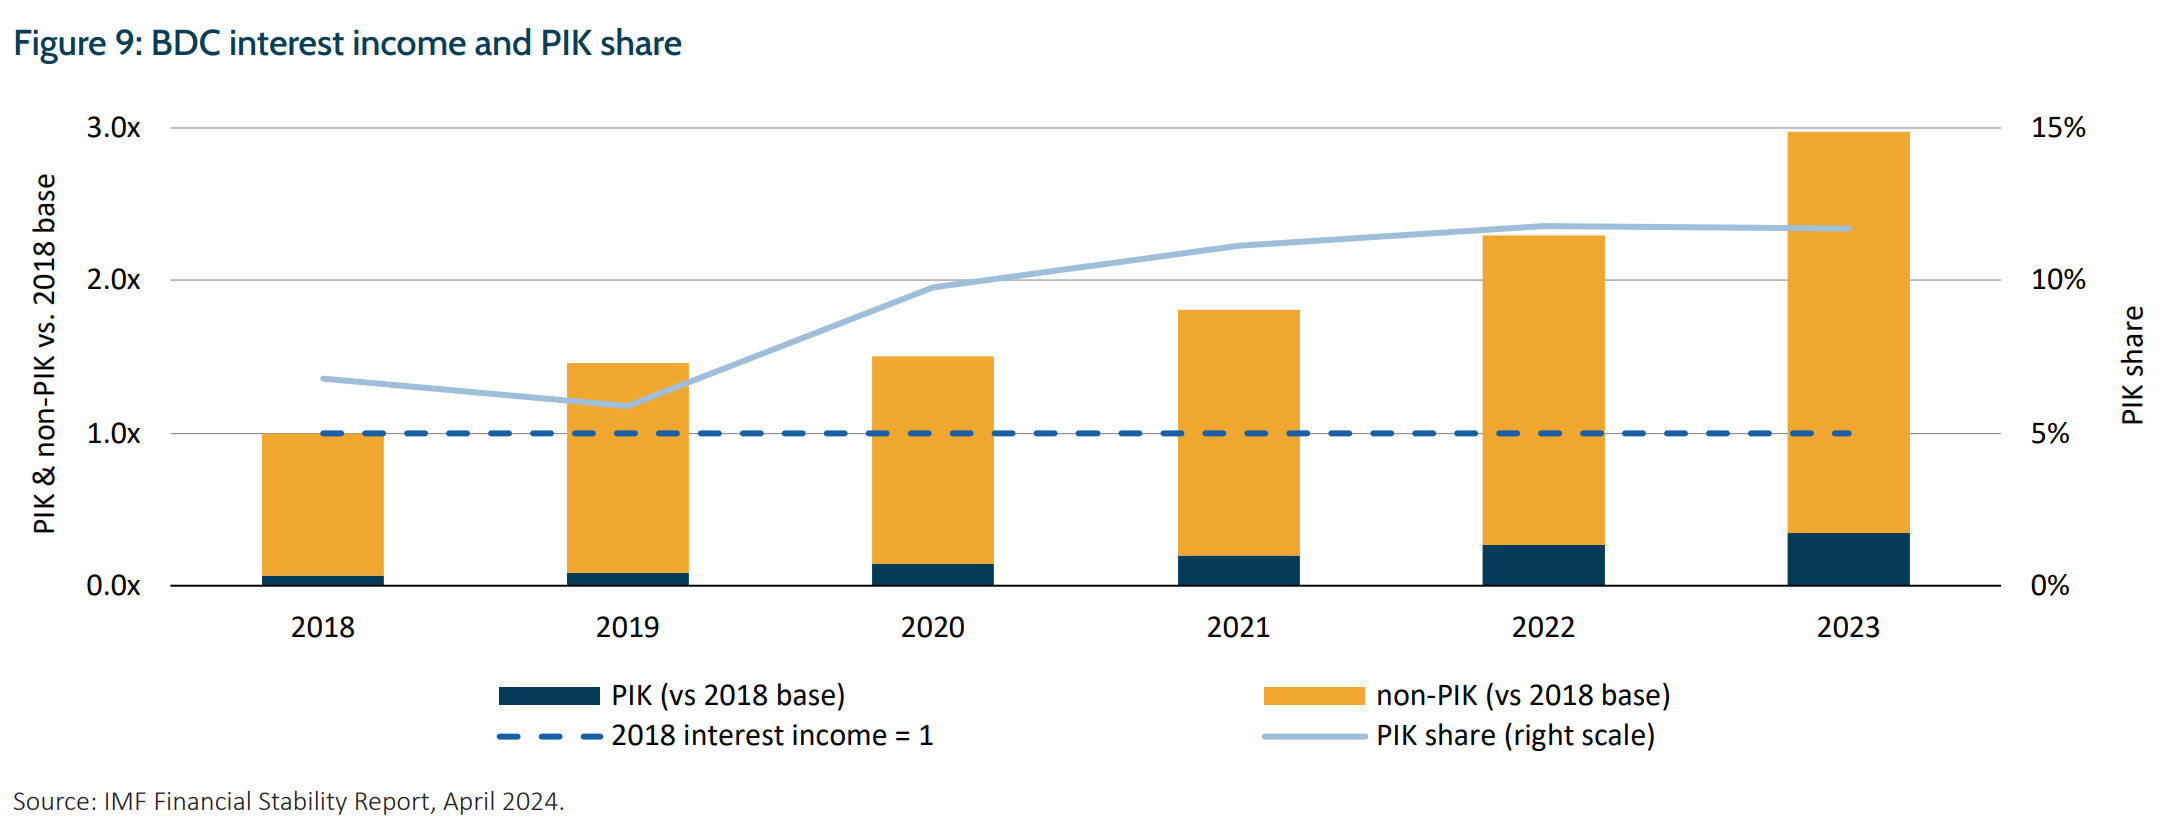
This option for direct lenders does mitigate some default risk, providing companies greater time and the lender to recoup funds, albeit with a different timetable than originally planned. Nonetheless, tracking PIK will serve as an indicator of credit quality deterioration.
Transparency is low
Our analysis highlights that a significant proportion of private credit borrowers paying more than 10% interest on loans have negative or neutral cashflow. Many are also borrowing on significantly higher leverage ratios than in the past. In public markets, prices adjust to reflect deterioration (or improvement) in credit quality, but private credit does not benefit from this price discovery process.
A byproduct of the significant inflows into private credit has been aggressive refinancings. Private lenders have faced considerable pressure to deploy capital, leading to more lenient underwriting standards and weaker covenants. To date, this ‘kicking the can down the road’ dynamic has worked, however we question the sustainability, particularly if inflows into private credit slow, or reverse.
Banks still exposed
In contrast with commercial bank lending, private credit has benefited from lower facilitation and operating costs and lower regulatory capital requirements. The banks’ participation in this part of the market has therefore changed. Rather than the direct underwriting and provision of riskier loans, the banks have provided liquidity backstops, investments via collateralised loan obligations and synthetic debt instruments such as swaps. They have also provided capital to structures such as BDCs, which are themselves typically geared at 1:1 debt to equity, a doubling over the last decade. This implies c.$100–150bn in debt is provided by commercial banks to the private credit sector. While this is <5% of commercial and industrial (C&I) lending today, the undrawn credit lines offered to the group are 5x this size and the provision of this backstop has supported the sector and its rapid growth over the last decade. Accordingly, private credit is integrated with the banking sector rather than a direct substitute and is linked in a less transparent manner than the past.
The Fed is also willing and able to support the commercial banking sector but despite calls to do so, there is no regulation or mechanism for Fed liquidity to be directly provided to private credit providers.
While undrawn credit lines do provide liquidity to non-banks should it be required, this interdependency creates a systemic banking issue to the extent private credit losses/outflows trigger liquidity calls from the banks which impedes broader credit availability.
Implications and Antipodes’ positioning
While we acknowledge low interest rates could be the salve for many of these building issues, it’s likely that under a higher for even a bit longer scenario, or worse, a recession scenario, a material proportion of these companies may continue to bleed cash and then potentially default. In this negative scenario, stale or unreliable valuations could lead to large valuation markdowns in these structures catalysing losses for investors as well as the banks.
A further nuance in this analysis is that although high yield and leveraged loans have always been widely available in recent years, access to private credit as an asset class has been brought to the public via retail funds. This will mean asset class flows may become more volatile over time.
Turning to the impact on the economy, we note the junk lending sector has not experienced a material downturn at its current size and nor have the features or levers of private credit loan design been tested. Further, the corporate recipients of this credit have become material employers in the US employing an estimated 20mn or greater than 20% of the US workforce. The next step for many of these companies may be the need to shed jobs due to financial hardship and this could trigger pressure on employment rates and catalyse weakening economic growth in a self-reinforcing negative feedback loop.
Given the size and opaqueness of the asset class, the risk of this leading to a loss of confidence with counterparties is real (private credit funds, insurers, private equity funds and investment banks) and could include a freezing in fund raising ability, a refusal to provide credit or liquidity to the sector or a run on funds. It would be difficult to put any withdrawal gating on this otherwise illiquid $0.8tn asset class without significant negative flow on effects to all risk assets which could exaggerate the economic shock.
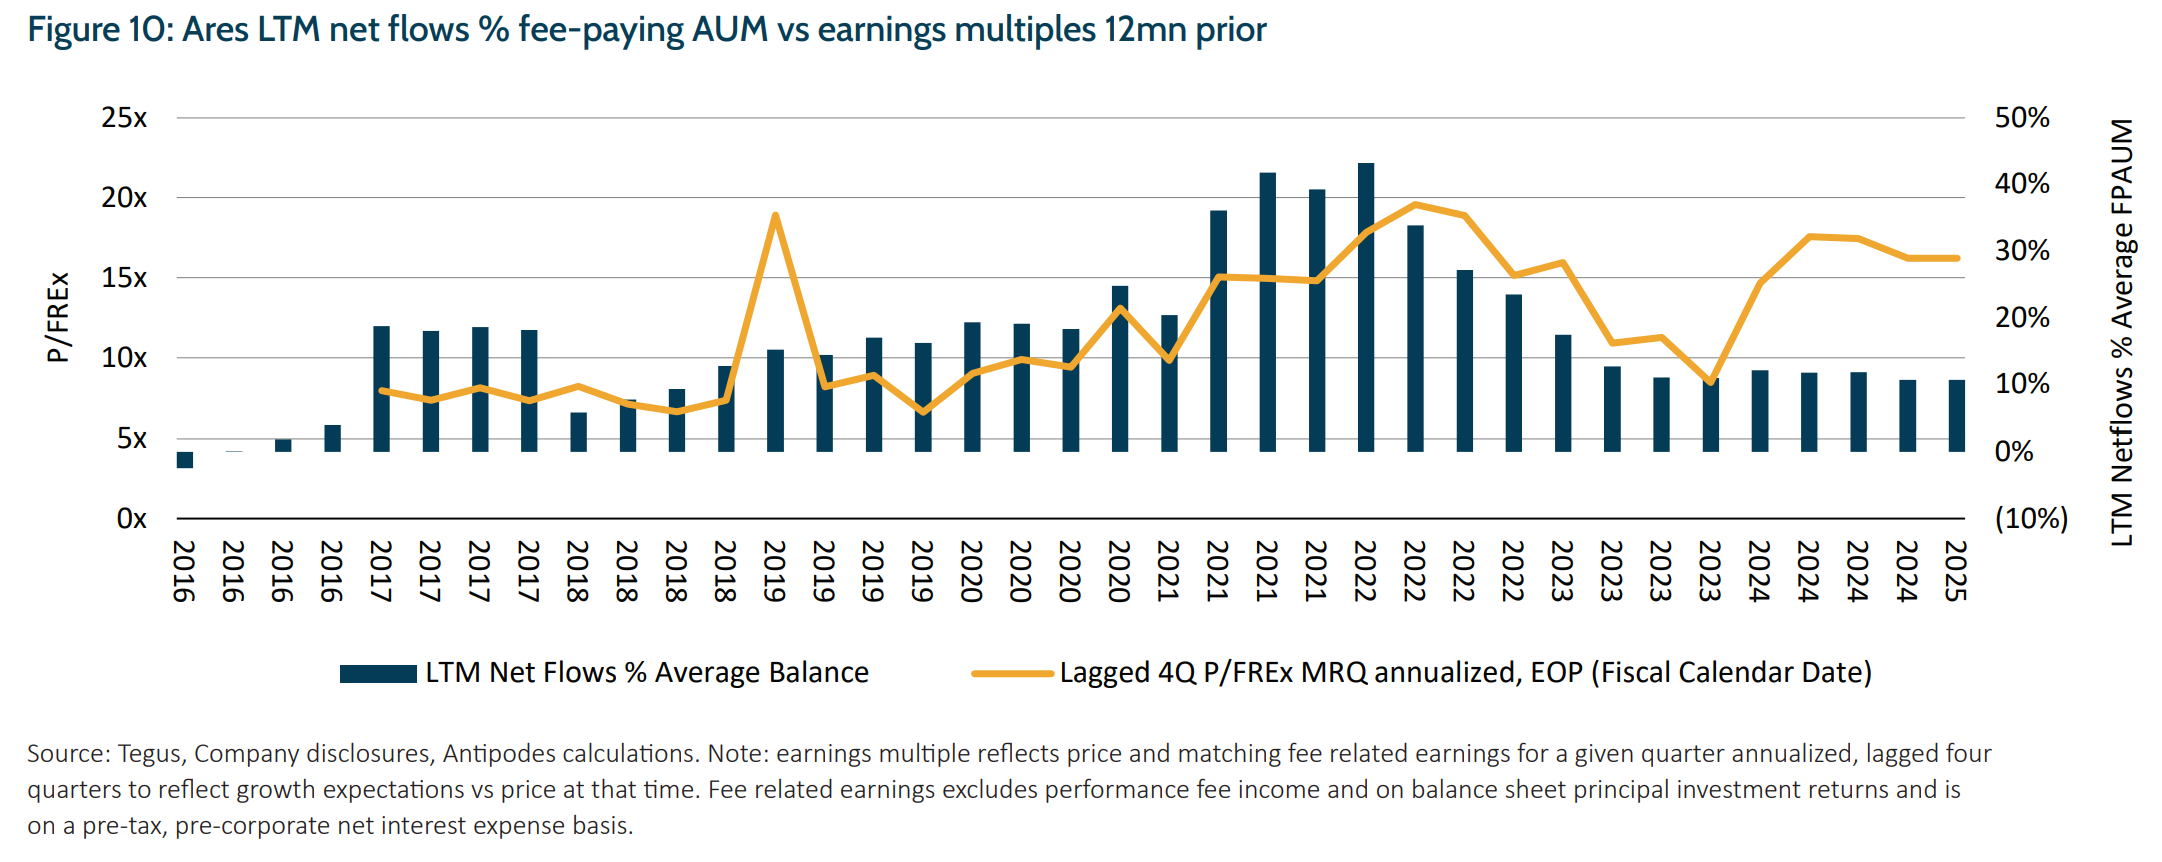
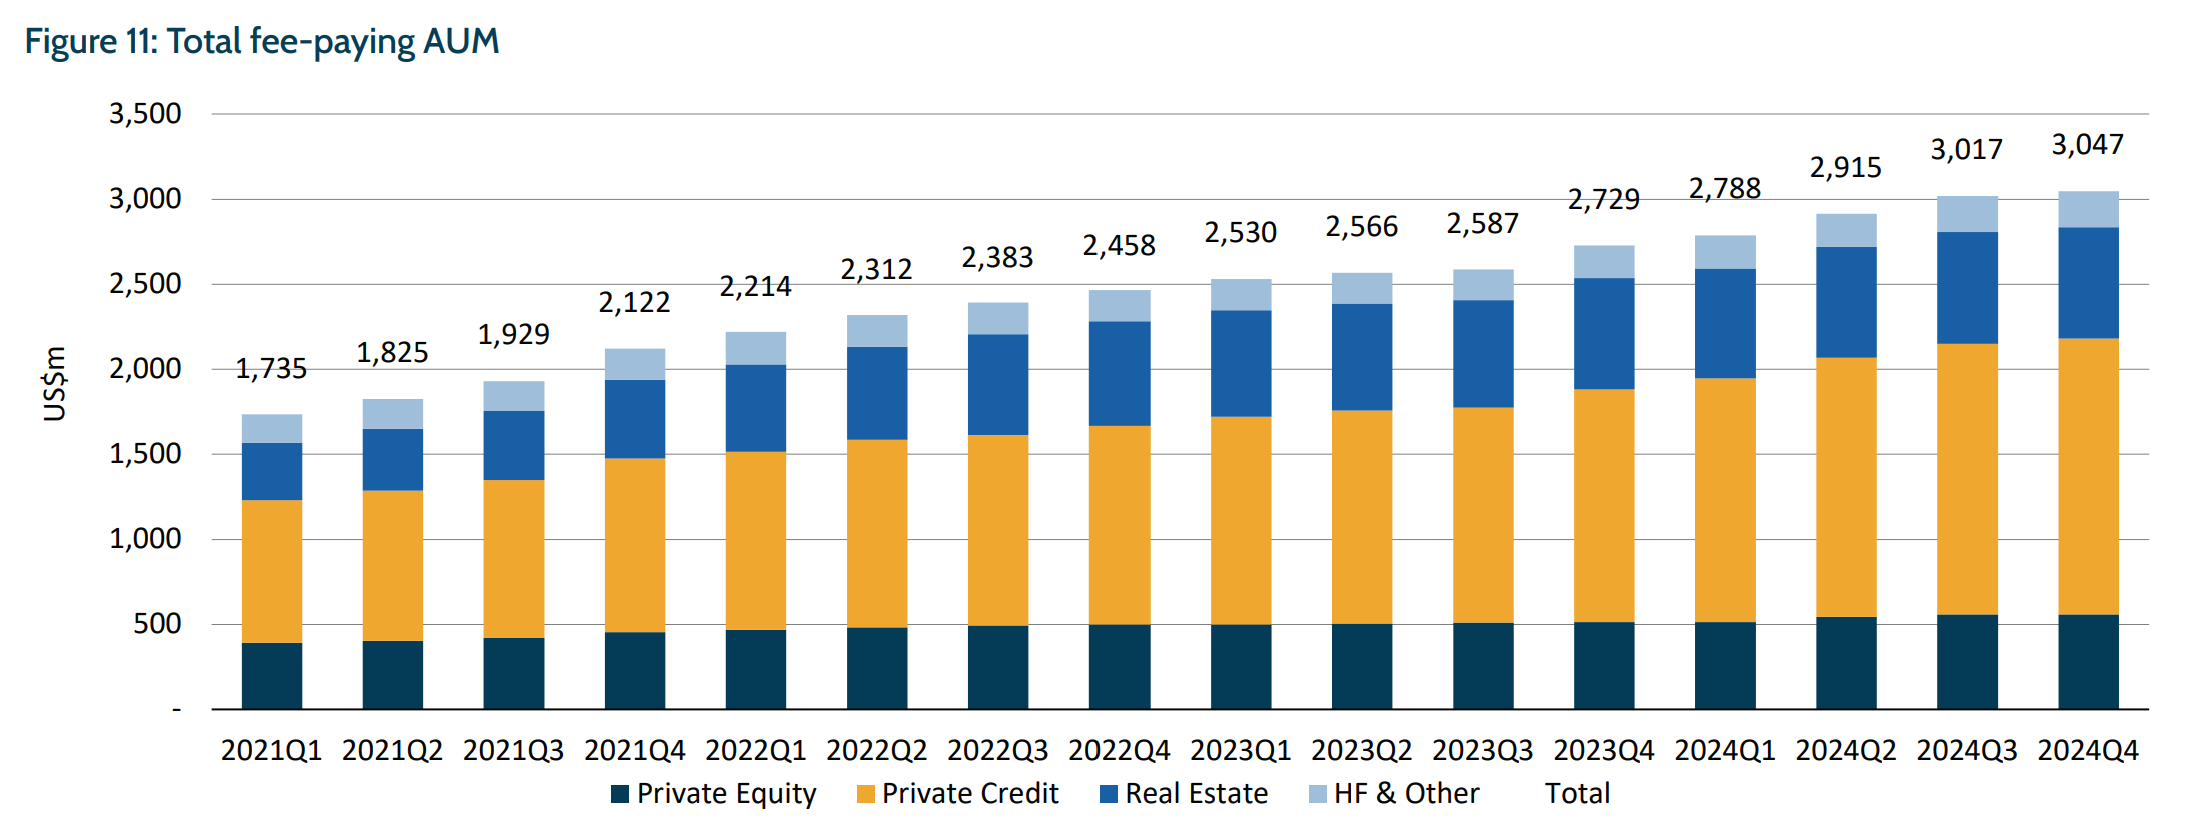
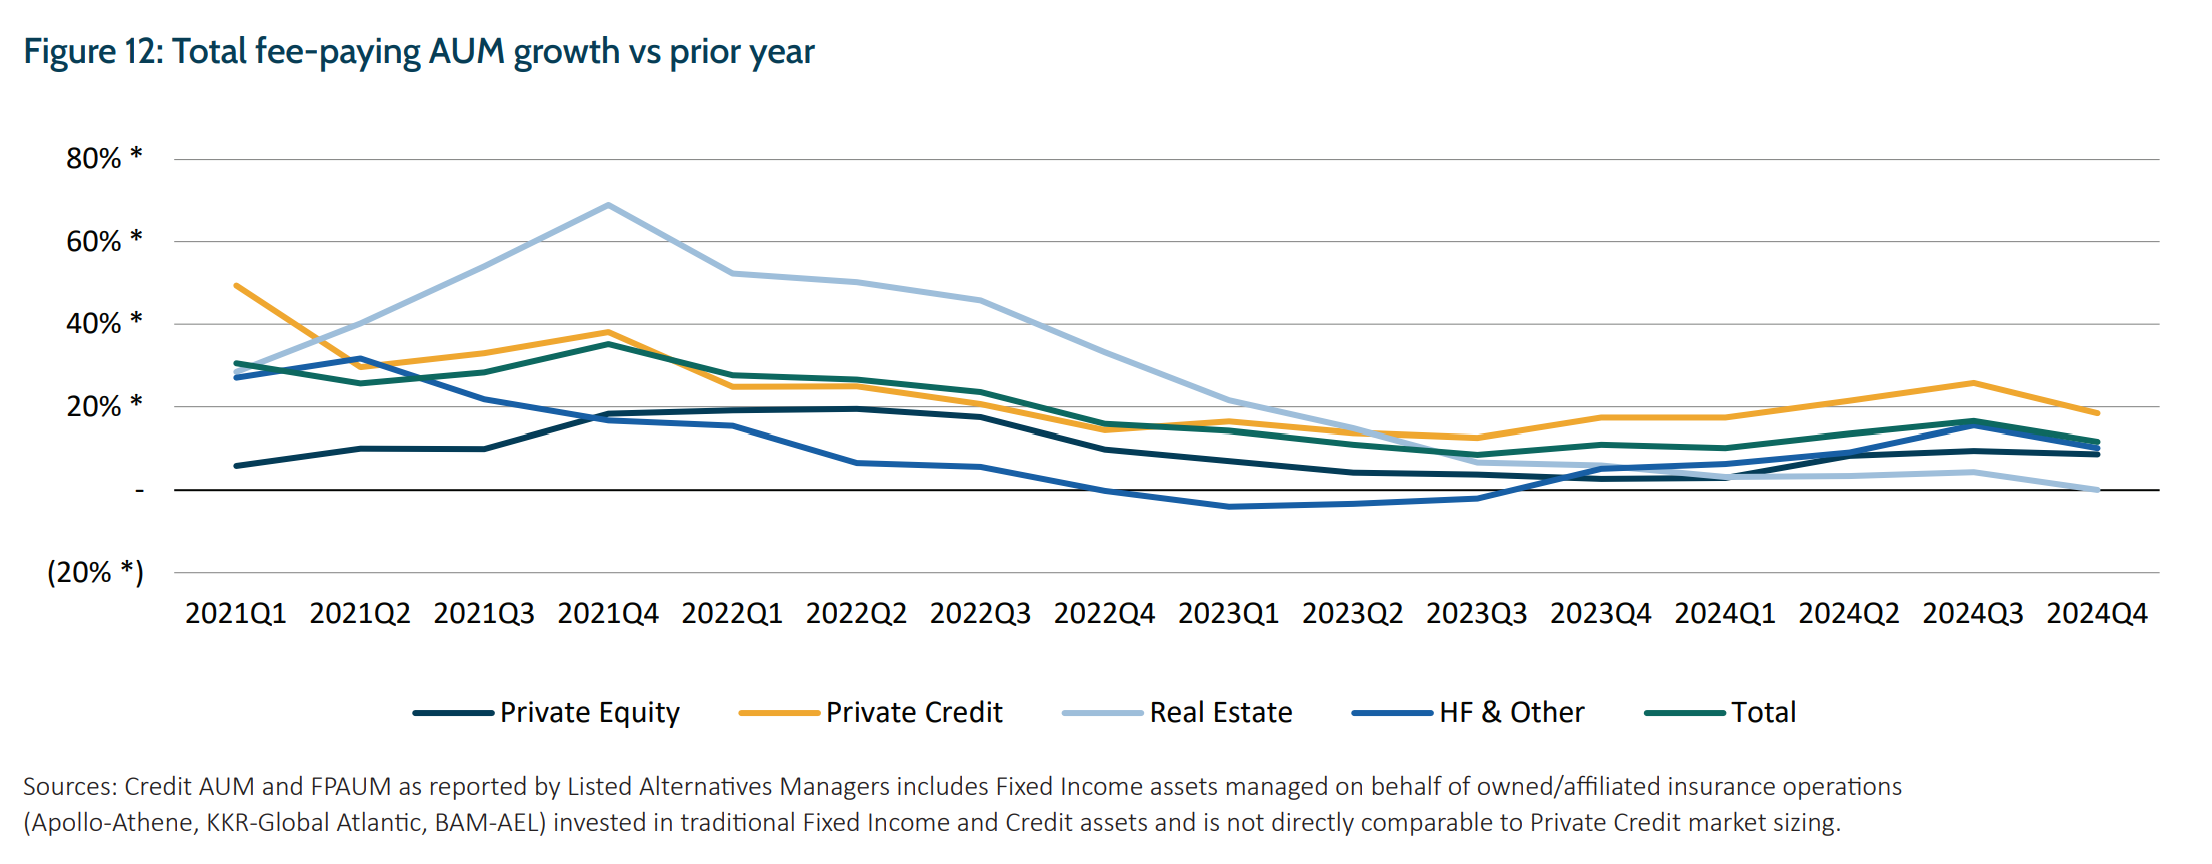
While the valuation multiples (Figure 10) on listed large alternative asset managers would suggest continued outsized growth, more recent fund flow data suggests the rate of growth has slowed significantly (Figures 11 and 12) as the cyclical shift to variable rate exposures and structural shift to private assets matures and investors start to entertain a shift back to defensive fixed rate exposure. In fact, private equity and real estate AUM growth has already slowed significantly faster and we expect this to be a lead indicator for private credit demand (given these two borrower types account for 70% of current outstanding loans). That is to say, the risks associated with slowing supply and demand for the asset class may have already started to play out.
Outside of this economic cycle risk, a further observation is that private credit lending has been very skewed to asset light service sectors like technology and healthcare that have coincidently seen rapid growth in investment over the last decade, clearly aided by the availability of capital. These sectors also carry a higher than average risk of technological disruption. The adoption of AI will represent a range of risks and opportunities for these companies, however, clearly the need to invest to stay competitive on productivity is more challenging for companies that carrying high debt. Further, in an environment where the market expects the benefits of AI to be concentrated in the hands of a few large, listed companies, we remained concerned that private equity carrying values remain challenged, as do exits. For a private credit lender to get its money back, in most cases the private equity borrower will need to find a buyer of the asset, i.e. an exit.
The liquidity and credit risks identified here, with real implications for employment are hiding in plain sight. Just as incentives were aligned on Wall Street to generate growth in the sector, these same incentives support further growth and potential selective disclosure of risk, despite potential risks rising. Incentives will likely encourage ‘a kick the can down the road’ approach to risk, which means any reckoning could be more extreme.
In summary, private credit excesses represent a tail risk that requires careful monitoring. While we expect interest rates to come down, the key is whether this happens via the benign rate cut scenario that is currently well priced by the US market or a less benign recessionary rate cuts. Further, should elements of inflation and therefore rates stay higher for longer, the chances of a credit event rise significantly. That event could very easily be triggered by a spate of defaults in highly levered, cash flow negative companies backed by private credit and private equity capital.
In Antipodes’ global long-short strategy, we have shorted weaker companies that are exposed to private credit risks and taken out relatively cheap credit tail-risk insurance via derivatives, and on our long funds we remain cautious regarding leverage exposure, especially where risks are not significantly discounted in valuations.
FOOTNOTES:
1 National Bureau of Economic Research, Where Do Banks End and NBFIs Begin? April 2024.
2 The other $800bn is comprised of a) Alternative Credit – loans that sit outside traditional corporate debt including real estate, and asset securitization of credit pools such as auto loans and b) Distressed Debt – listed and to a lesser extent unlisted debt with a particular focus on distressed sellers e.g. Blackstone Stressed/Distressed fund I/II/III, Oaktree Opportunistic Credit.
IMPORTANT INFORMATION:
This communication is prepared by Antipodes Partners Limited (‘Antipodes’) (ABN 29 602 042 035, AFSL 481 580) as the investment manager of the Antipodes Global Credit Opportunities Fund (the ‘Fund’) and is intended for wholesale clients only. Pinnacle Fund Services Limited (‘PFSL’) (ABN 29 082 494 362, AFSL 238371) is the product issuer of the Fund and is a wholly owned subsidiary of Pinnacle Investment Management Group Limited (‘Pinnacle’) (ABN 22 100 325 184). Past performance is not a reliable indicator of future performance and the repayment of capital is not guaranteed. Any opinions and forecasts reflect the judgment and assumptions of Antipodes and its representatives based on information available as at the date of publication and may later change without notice. Whilst Antipodes, PFSL and Pinnacle believe the information contained in this communication is reliable, no warranty is given as to its accuracy, reliability or completeness and persons relying on this information do so at their own risk. To the extent permitted by law, Antipodes, PFSL and Pinnacle disclaim all liability to any person relying on the information contained in this communication in respect of any loss or damage (including consequential loss or damage), however caused, which may be suffered or arise directly or indirectly in respect of such information. Unauthorised use, copying, distribution, replication, posting, transmitting, publication, display, or reproduction in whole or in part of the information contained in this communication is prohibited without obtaining prior written permission from Antipodes.