
Countless hours have been dedicated to commentating on the dramatic collapse of Silicon Valley Bank and subsequent takeover of Credit Suisse. Investors and regulators alike have contemplated the implications of this spectacle and in particular the contagion risk to deposit confidence in the banking system in the US and beyond. US regional banks have been in specific focus with rapidly rising rates highlighting their balance sheet asset liability mismatch and risks to profitability1.
Trust is at the crux of these anxieties.
Closer to home, recent commentary from Australian financial regulators is of a sanguine outlook for the Australian banking system with the recent speech by APRA Chair John Lonsdale representing the view that “we might be connected but their issues and problems are not necessarily ours” and followed up with a publication of stress test results indicating banks would survive the ruinous scenarios painted.
The point made by APRA that the US issues aren’t ours is true in that our banks typically initiate and hold floating rate loans on balance sheet and so don’t have the same exposure to bond mark-to-markets and the asset liability mismatch that comes from 30-year fixed rate household mortgage lending2and a highly competitive funding market (versus our largest banks that have relatively sticky deposit bases). It is also fair and appropriate for regulators to provide reassurance rather than fan the flames of contagion risk fears.
The parallel argument here is that there is also inherent trust that the regulator is ‘on it’ and has ensured that the processes are in place to protect the system. We know however from past and, let’s face it, recent experience, that holes in the regulatory model are typically revealed by a building tail risk left unaddressed, that is almost always considered obvious in hindsight, rather than a rerun of the last crisis.
The Australian version of the 2009 crisis was triggered by our banks having too great a reliance on wholesale funding markets, and not enough near-term liquidity – the primary focus of post crisis banking regulation. Hence, the consensus in Australia seems to have been “nothing to see here, go back to your overpriced smashed avocado toasts”. But just because the US issues do not apply does not mean we don’t have our own system issues to contemplate. Our focus should be identifying the areas of banking system vulnerability that are relevant to the Australian market.
Australian housing
On this front, we’re a little concerned that the ongoing commentator focus on liquidity stress tests and the stricter treatment of on-balance sheet securities misses a few important points: During Covid, Western Central Banks reinforced loose fiscal policy via aggressive quantitative easing creating surplus deposits in their respective banking system which inevitably found their way into lending, some of which would be fixed rate and with the US being the worst offender, though arguably the RBA was not far behind. This over stimulus led to inflation and these same Central Banks have then responded with a seismic policy rate shift, the aftershocks of which are now being felt as a major headwind for the economy and banking system profitability.
A boom in Australian house prices was another consequence of the RBA’s pro-cyclical easing. Our analysis suggests almost all the $300b or 20% growth in mortgage debt since Covid has been at low fixed rates of around 2%. Specifically, the RBA during Covid provided banks with A$188b under the Term Funding Facility (TFF) fixed at 10bps for 3 years funding roughly 60% of incremental growth in mortgage debt and equivalent to 10% of mortgage debt outstanding. TFF peaked in June-21 at $188b with very little repaid, though 40% must be repaid by Sept-23 and the remaining 60% by June-24, which is why banks are preemptively raising expensive wholesale funding given this impending maturity cliff.
In the US, the interest rate shock impacted banks absorbing rising rates themselves (with little ability to pass it on to households as home loans are fixed for a very long term) …
…In Australia the vulnerability lies with indebted households as the Australian banks pass on rate rises and higher funding costs to their mortgage customers, but in doing this, banks need to balance credit risk versus margin or earnings risk.
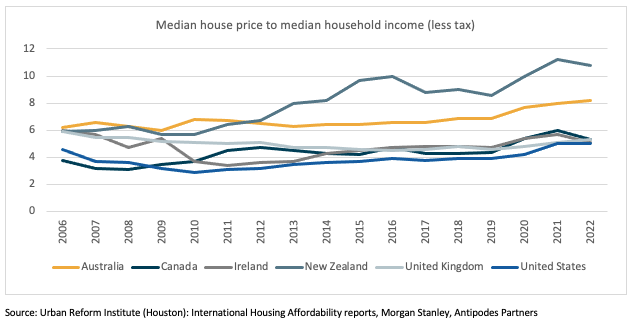
These risks are exacerbated by extreme housing unaffordability versus other developed markets, with the Australian median house price at 8.2x post-tax income and with all major cities “severely unaffordable”3. This situation worsened materially during the pandemic due to the RBA’s super stimulatory policies and APRA’s historical removal of many macroprudential related restraints, as discussed later in this paper, which led to a boom in riskier residential lending.
There is a further concentration risk relatively unique to Australian households which is their multiple layers of exposure to residential property via direct holdings and via savings and superannuation funds with a home bias to Australian fixed income and equities (where the banks which have a very high exposures to residential lending account for 22% of the local equity benchmark versus 9% for the global benchmark). There is also contagion risk in the fat that around half of small business lending is also collateralised with a residential mortgage4.
The vulnerability of our economic fortunes and system to house prices is hardly new news and not all of it is bad. Banks are sitting on considerable reserves of home equity, with average dynamic loan-to-value ratios (LVR) on loans (made over many years and at far lower than today’s house prices) averaging less than 50%5.
As such we highlight risks that are not blanket concerns but rather relate to segments of the system where significant points of vulnerability exist. To elaborate:
- A third of loans have been made to investors that may have multiple properties. We know that 26% of households are landlords and that 12% of property investors own three or more properties outside of their main residence6 and that negative gearing along with a bias towards interest-only loan terms incentivizes re-leveraging7.
- Within the 37% of households with mortgages, there are cohorts that are particularly highly geared. In 2017, the RBA8 estimated that 5% of households (or 13.5% of households with a mortgage) account for 30% of all household debt. This group has loan-to-income (LTI) ratios of > 600% and we estimate the median within this cohort is remarkably >900%9. Notably this group is represented across all income bands. What’s more concerning is the underwriting standards of mortgages originated post Covid, with around 20% made to borrowers with > 6x Debt-to-Income, peaking at 25% in 202110, and 35% (or circa 10% of the current stock of loans) made at LVRs of > 80%11 and at average prices 15% above today. Despite these house price declines, we estimate that the restoration of some semblance of affordability requires a further 10-15% drop which will send c.10% of these newer investor and repeat purchase owner occupier loans, and 25% of these first home buyer loans into negative equity12 and further compound systemic risk by impacting the solvency of mortgage insurers that are vital to the ongoing flow of mortgage credit.
- As noted, around one-third or $700b of the current stock of residential mortgage debt is on fixed-rates of close to 2%13, with around half of these written post Covid and funded by banks via ultra-cheap funding from the RBA. Around two-thirds will reset into variable-rates 300bps or higher by the end of 2023, leading to mortgage payment increases for these households of at least 30%.
Against these headwinds, the RBA is stuck with a timing issue: it needs to raise rates to combat inflation and it can’t really wait for it to come down ‘on its own’ as inflation begets inflation expectations and runs the risk of being ‘out of control’ – but doing so has negative consequences for households. An awareness of these unique circumstances has no doubt been part of the reason for the RBA’s decisions to not move rates up in lock step with the Fed in this cycle to date, including the most recent decision to pause and wait for now.
Further complicating the RBA’s inflation fighting mission is limited ex-ante data on how monetary policy will transmit to the real economy this time around, and we admit that this cycle is unprecedented. To elaborate, consider the 30%14 of the population comprised of relatively wealthy households without a mortgage that also account for a disproportionate share of consumer spending and excess savings. This cohort is relatively insensitive to rate rises – in fact they benefit from higher returns on cash/rents and may continue to spend and pressure inflation. This appears to be the RBA’s central case. The alternative is that the excess savings do not get deployed domestically or in a more gradual manner. Having a concentrated and systemic buildup of leverage in a single asset class such as housing increases the risk of policy error.
The immediate outcome of these imbalances is that we have a cohort of severely geared households that have been impacted by cost-of-living pressures, including materially higher rates (already or soon to be reset) and the looming risk of negative equity in their homes.
The remaining households that rent will also face increasing pressure on disposable income as geared landlords pass on their interest rate shock via a ‘rental shock’ as the reset takes place. This is in addition to the average 26% rental increase that has taken place over the last year across Australian capital cities15, including > 50% increases in some pockets.
It is this extreme dispersion in outcomes across different household cohorts that the RBA is grappling with as it combats inflation.
Unquestionably strong banks
While our banks remain protected from asset-liability mismatch risk, their exposure to a cohort of very weak borrowers challenges the thesis that they are “unquestionably strong”. The shocks that might cause these imbalances to unwind are difficult to predict – for now, immigration ensures tight housing markets and prices, whilst negative gearing policies ensure large interest and rental losses can be funded, thereby masking credit issues. But as discussed below, APRA’s soft touch macroprudential oversight overlayed with over 30x average leverage on banks’ mortgage books and thin true excess capital buffers versus other jurisdictions provides for limited margin of error.
The table below illustrates the capital position of a sample of banks across the world.
The common equity tier 1 (CET1) ratio (row 1) we are seeing published to illustrate Australian banks’ relative strength are apples to oranges comparisons utilizing different regulatory regimes and different thresholds versus the Basel III minimums. It’s also dubious to suggest that capital would be at a significant surplus under an international regime – if only Australia had a different regulator! We’re assuming APRA sets standards for the specific risks faced by Australian banks, that is, the very high exposure to residential mortgages (row 2).
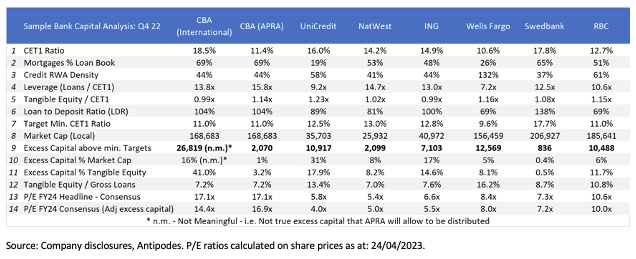
We can see here that given the banks’ respective regulatory regimes, Australian banks are fairly capitalized but are not leading the pack and indeed are only just meeting regulatory minimums (row 9).
At the simplest level of bank capitalization, that is the level of tangible equity to loans (row 12), which normalizes for differences in risk weightings across mortgages and other loans, the Australian banks are amongst the bottom of the pack while also sporting high relative leverage ratios (loans to CET1 – row 4) and loan-to-deposit (LDR) ratios (row 6).
The average risk weighting of 25% applied by the major Australian banks across their entire mortgage book implies a lower risk weight for owner occupied mortgages and is not meaningfully different to those applied by other global banks and regulators, which begs an obvious question given the uniquely concentrated nature of this risk in the Australian context. Also, whilst APRA is more stringent on CET1 calculations, it is not in setting the absolute minimum – for example, NatWest, ING and Swedbank target minimum CET1 ratios that are a lot higher than CBA despite having an equally healthy exposure to full-recourse mortgages (row 7).
One might question whether these international banks truly carry less risk when measured by their relatively lower leverage – here it’s important to highlight the plethora of Loan to Value (LVR), Loan to Income (LTI), serviceability, investor versus home buyer and amortization rules applied in other jurisdictions offer an additional safety net when compared to APRA’s less stringent macro prudential policies (MPP).
In Australia the key MPP policy change was a 50bps increase in serviceability buffer to 3% applicable to new lending implemented in late 2021, implying many loans may have been underwritten at rates close to or below 5% and certainly below current mortgage rates being paid. This incremental protection after the extraordinary house price growth over the prior decade was arguably too little, too late and has potentially created a pro-cyclical system risk as house prices fall. To contrast with a few international examples, the UK and Ireland have had a 4-4.5x LTI limit on mortgage lending since 2014 with <10% of loans written since Covid exceeding this, Sweden has required mandatory amortization of mortgages (i.e. tackling interest-only borrowing) since 2016 whilst Canadian banks underwrite to an absolute floor rate of 5.25% when assessing serviceability, despite benefiting from government guaranteed insurance protection on all loans over an 80% LTV. Nearly all these markets curb the amount of high LTV lending to investors. By contrast, APRA systemically unwound such measures in the years leading up to Covid, all of which would have worked to curtail the affordability scenario that Australia now finds itself in.
It’s important to emphasize that the risks to capital ratios come in the form of a potential escalation of loss rates on mortgage loans. It’s fair to say that historically this has never been an issue. Loss rates in the context of rapid house price growth and a strong economy have been negligible for many years. However, the excessive escalation of house prices of recent years means this collateral – in the proportion of loans more likely to experience delinquency – is fundamentally riskier than in the past and certainly riskier than the historically formulated risk weightings of 25%, or over 30x leverage, would mathematically imply.
New residential loan commitments declined by 19% year over year in the second half of 2022 as interest rates rose – the fact that affordability has become materially worse in the last year hampers recovery as lending can only restart with lower house prices or lower rates. Banks under pressure to increase capital levels and loan loss provisions as delinquencies rise may further hinder lending and stymie a recovery. Prior to this we would expect loan restructuring activity by banks to accelerate to get in front of potential delinquencies.
As noted, for Australia, the period we are most interested in are the loans made 2020-22, many of which are or soon will be subject to meaningful interest-rate shocks. Only a small portion of these loans need to default for banks’ thin capital surplus over regulatory minimums to be tested and the sustainability of current dividends to be questioned.
Investor risk versus return
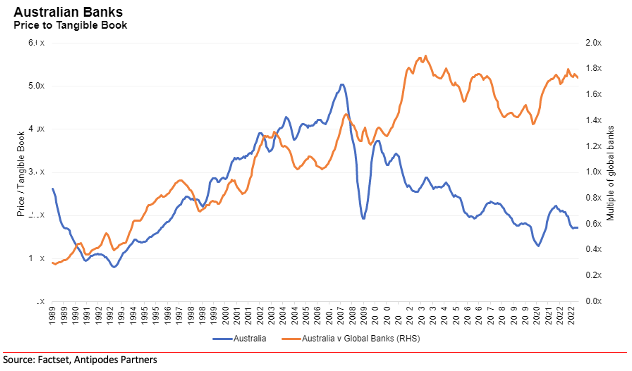
Exogenous inflation factors are now moderating, and there is the possibility that a hard landing can be avoided via rate cuts, however, the time for this scenario to play out is running out. The affordability challenges of the Australian residential property market create a downside skew to the risk profile of Australian banking stocks, which might be palatable if valuations more than compensated for this risk. But they don’t – against global peers, Australian banking valuations have rarely been more expensive.
Adjusted for excess capital, the Australian banks are trading on a significant premium to global peers with CBA trading on 16.9x FY24 earnings vs. the European banks on <7x. Investors are not adequately compensated for the housing, capital adequacy & wholesale funding risks sitting within the Australian banking sector. Further, the degree of surplus capital relative to market capitalization (row 10), is a key measure of a banks’ potential to sustain shareholder returns via dividends and/or buybacks. Any need to bolster a bank’s capital position puts shareholder returns at risk. On this measure, Australian bank shareholders, especially dividend yield seeking ones, are in an extremely vulnerable position.
Note: Antipodes Partners is short Australian banks as a tail-risk hedge against global bank long holdings and general equity exposure.
1 Unlike large US banks, the regionals were not required to mark bond losses to market.
2 The default for a US home loan.
3 Measured by the Urban Reform Institute at median house to income ratio of > 5.1x. The Australian figure increased from 6.9x in 2019 to 8.2x in 2022. Australia has had the most severe loss of housing affordability since 2020 as measured by the rate of house price increase to income – Source: Urban Reform Institute (Houston): Demographia International Housing Affordability report: 2023 Edition.
4 RBA Financial Stability Review: April 2023
5 Helia FY22 result presentation (24/02/2023)
6 ABS: Housing occupancy and costs: 25/05/22 release: 2019-2020 financial year
7 RBA Financial Stability Review: April 2017 found 64% of investment properties funded by Interest Only loans
8 RBA Financial Stability Review: April 2017
9 Digital Finance Analytics polling data (2017), RBA Financial Stability Review April 2017, Antipodes analysis.
10 RBA Financial Stability Review: April 2023 – Graph 3.9: The share of ADI’s new lending at a DTI > 6x increased from a low of just less than 15% in 2018, increasing to 25% in 2021. In 2022 this has fallen to c.12%, co-incident with a broader reduction in new residential mortgage lending.
11 Helia FY22 result presentation (24/02/2023) states that prior to 2020, LVR > 80% was around 20%
12 RBA Financial Stability Review: April 2023: Graph 3.8 – shows the sensitivity of new loans (those made since January 2020) to house price declines. The 20% decline has been used as the chart was based on January 2023 house prices, whereas our statement applies to a further decline from today.
13 RBA Financial Stability Review Oct-22 p. 29
14 ABS: Housing occupancy and Costs: 25/05/22 release: 2019-2020 financial year
Subscribe to receive the latest insights and updates from Antipodes