Key points:
- The Fed pivot is coming, but we aren’t there yet – investors must think about how the tightening cycle impacts the real economy
- HOPE should not be an investment or policy strategy – but it’s a great acronym for recognising the impacts of tightening
- Don’t wed to old winners in the market drawdown – new winners will emerge in the next market upcycle
- Fiscal activism will continue, and greater volatility in the economic cycle will weigh on valuations – we have seen this before
- Siemens Energy is a good example of a Pragmatic Value exposure to the decarbonisation investment super-cycle
The Fed pivot
Arguably, investors have never been so focussed on the US Federal Reserve’s next move. Our team is asked about it a lot. Our view – the pivot is coming, but we’re not there yet.
Even with this is mind, we think wedding to yesterday’s winners in this market drawdown is futile as we’re now in a fundamentally different regime of fiscal activism, which will see new winners emerge in the next market upcycle.
So first, turning to the impacts of a tightening cycle on the real economy. HOPE is a great acronym to understand this – a far better acronym than a strategy.
It entails four key areas impacted by tightening – housing, orders, profits, employment.
Housing
Unlike Australia, US households finance property ownership via fixed rate mortgages. This means interest rate hikes are felt by households taking out new mortgages rather than impacting existing mortgages (and household disposable income). So the slowdown from a tightening cycle in the US begins with home sales/housing activity.
Figure 1 shows secondary home sales in the US were down around 35% yoy in December and have been declining for the last 11 months. This is 4% worse than the 2008 financial crisis and the longest stretch of sales declines in more than 20 years.
The housing sector is our leading economic indicator, and sales are yet to turn.
Figure 1: Existing Home Sales (% change yoy)
Source: National Assoc. of Realtors
Orders
The next domino in the chain is orders.
Slowing housing activity eventually feeds into weaker demand more broadly across the economy.
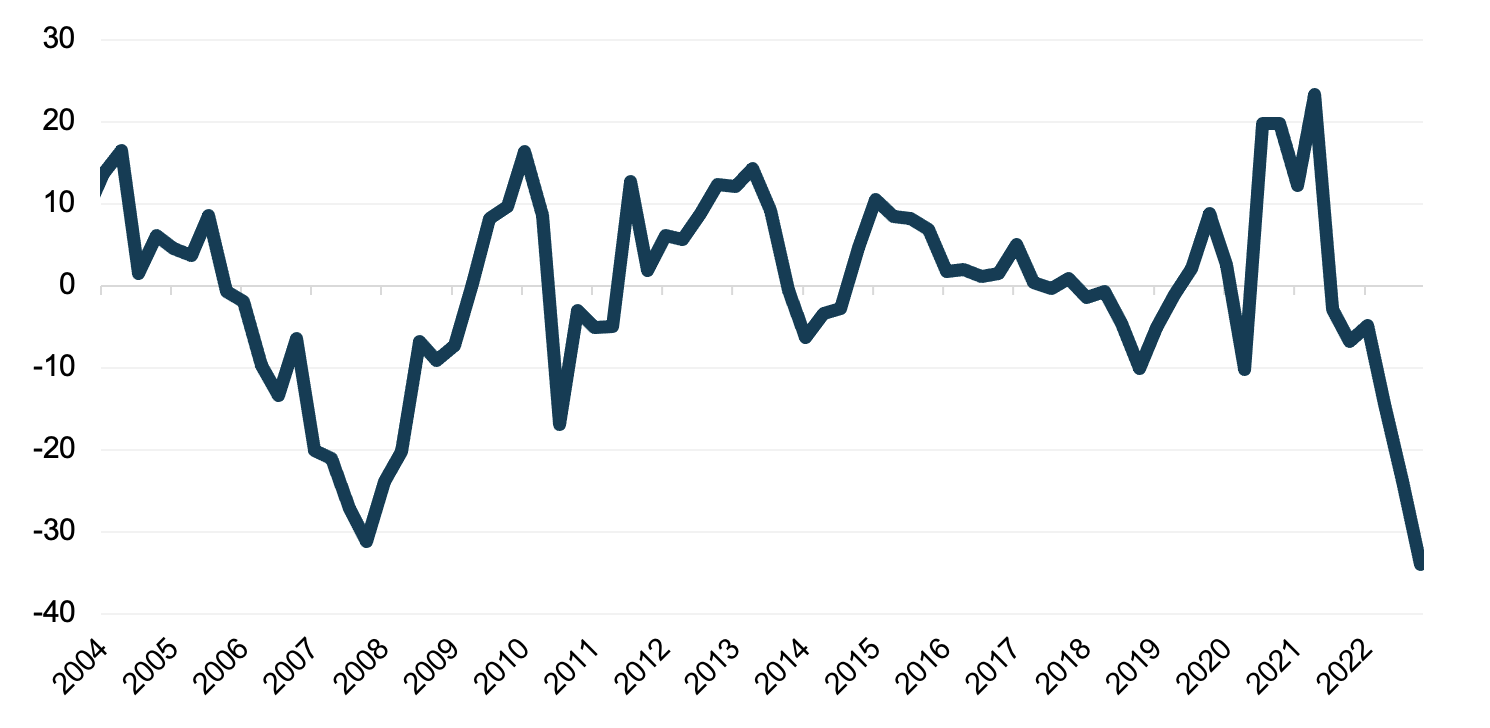
The US ISM New Orders index is a survey of new orders in the manufacturing sector and is a good proxy for goods demand. A reading below 50 indicates new orders are lower than the prior month, while a reading above 50 indicates orders are higher versus the prior month. Figure 2 shows new orders have been falling since mid-2022, and again we have the sharpest decline since the 2008 financial crisis. This is a negative signal for broader economic activity.
Figure 2: Institute of Supply Management (ISM) New Orders index

Source: Institute of Supply Management
Profits
Weaker business activity ultimately hits profits.
Today, corporate profits continue to hover around all-time highs as a percentage of GDP (Figure 3). This is unsustainable with leading signals from Housing and Orders pointing to a profit downgrade cycle. We find it remarkable that analyst forecasts still imply upcoming earnings will be relatively flat compared to last year. Using prior recessions as a guide, earnings forecasts in the US could fall at least another 10% which would lift the starting valuation of US equities closer to 20x forward earnings, which is a 15 – 20% premium to historical valuations.
Figure 3: After Tax Corporate Profits relative to GDP (US)

Source: Bureau of Economic Analysis
Employment
The final signal is employment.
Corporates don’t reduce their workforce until after profits have been impacted by slowing conditions. Unemployment remains at record lows in the US despite the weakening outlook because it is a lagging indicator.
Figure 4: US unemployment rate

Source: Bureau of Economic Analysis
A tight labour market is the reason the Fed hasn’t blinked, despite forward looking indicators painting a bleak picture of continued weakening activity.
The Fed needs to run monetary policy tight enough to slow conditions such that it reduces the pressure in the labour market. That is, slow the economy, lift unemployment, take the heat out of wages which are still growing at above trend rates, and ensure inflation is under control.
So we reiterate – the Fed pivot will come, but we’re not there yet.
The tail risk remains – and is arguably rising – that the Fed over-tightens resulting in a hard landing for both the US and the weaker constituents of the global economy. This is not priced into US equities generally and nor is it priced into some of the more obvious candidates for collateral damage – countries with high levels of private sector debt and exposure to variable rates.
What’s next? (We’ve seen it before)
While all of the above is playing out, a powerful shift to fiscal activism continues.
This shift began with the 2017 Trump tax cuts, accelerated with COVID stimulus, and now a policy-led investment cycle focused on decarbonisation, onshoring and infrastructure is emerging.
The more pressure tightening places on economic activity, the greater the chance policy makers respond with even more fiscal stimulus.
Volatility in policy will drive greater volatility in the economic cycle, and we have seen this playbook before.
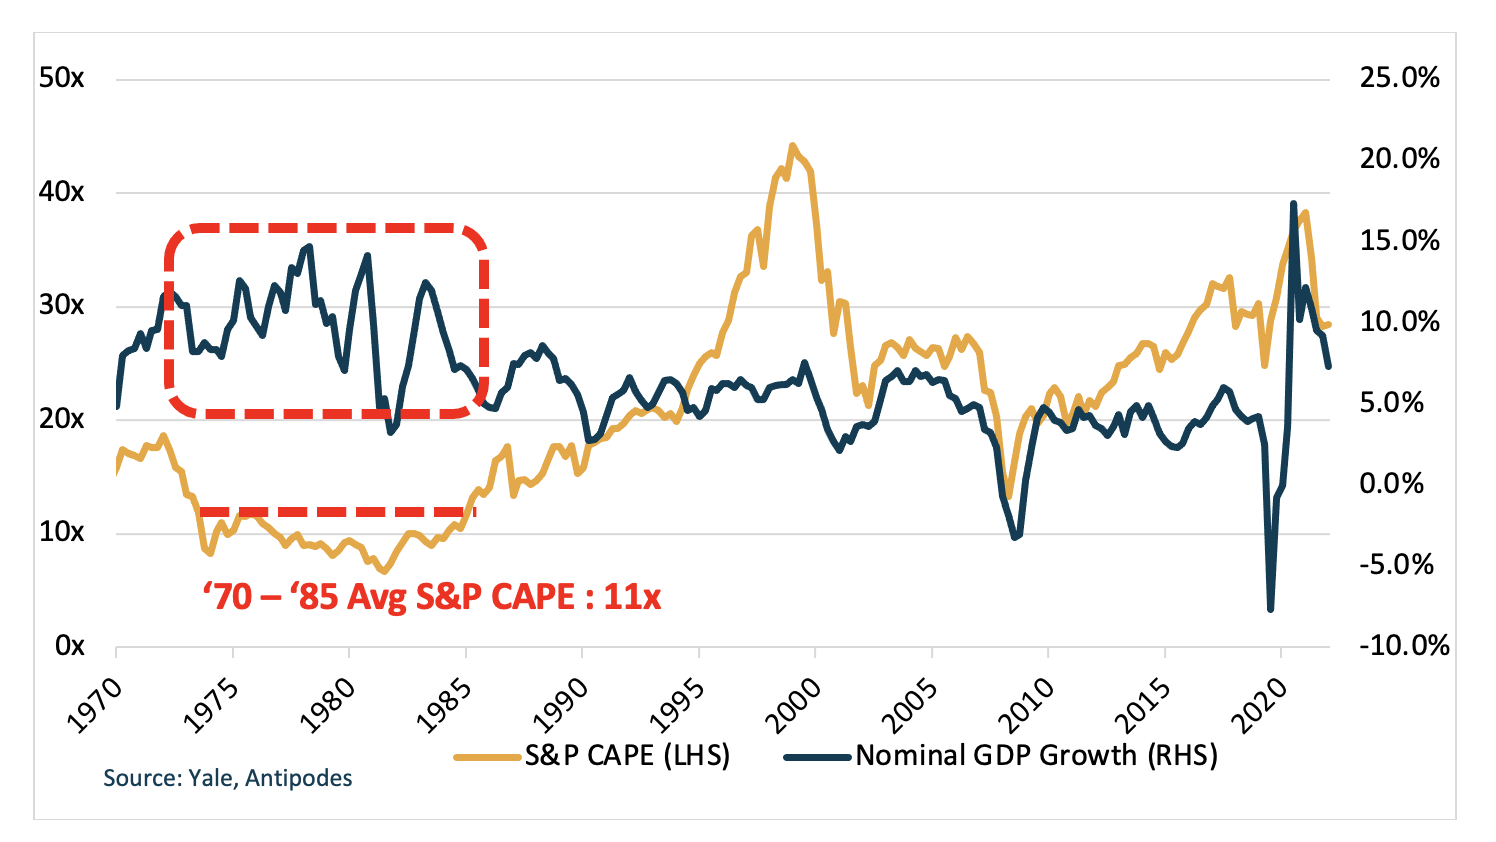
Today’s macro backdrop looks very similar to the 70s and 80s. The 1970s saw a stop/start approach to policy, which oscillated wildly between tightening to control inflation and loosening to support a flagging economy.
As Figure 5 highlights, the outcome was meaningfully greater volatility in nominal GDP growth, and we know the market doesn’t like volatility as it drives up discount rates. The 70s saw a structural derating in equities to c. 11x cyclically adjusted earnings before high inflation was ultimately tamed, coming with the cost of a large recession in the early 1980s.
Volatility in nominal GDP growth has already increased as a result of recent policy, but today’s valuations still sit at almost 30x cyclically adjusted earnings.
Figure 5: Nominal GDP versus S&P Cyclically Adjusted PE (CAPE)
Investing for a fundamentally different regime
This is why the focus of investors must be on new winners, not old – or what is often referred to as “buying the dip” of prior winners.
Fiscal activism around decarbonisation, onshoring and infrastructure will result in a fundamentally different regime, which will see new winners emerge in the next market upcycle.
To decarbonise global energy systems by 2050, on our analysis we need to increase the use of electricity roughly three times relative to what we consume today, which calls for an increase in wind/solar generation of up to 20x current levels. Siemens Energy is a leading manufacturer of gas and wind turbines and grid technologies, and is one of the most well-rounded and mispriced exposures to energy transition in the market today.
The build out of offshore wind turbines is critical to meet renewable energy targets given stronger winds and fewer hurdles around land access relative to onshore infrastructure.
Stock in Focus | Siemens Energy (ETR: ENR)*
An example of a company that can be a winner in this investment cycle is Siemens Energy.
Siemens Energy is a global leader in the supply of wind turbines, particularly offshore, and is also a leader in utility scale gas turbines. As well as the role gas plays as a steppingstone to net zero, gas can also solve for the need for back-up power. Wind and solar generation is intermittent; the sun doesn’t always shine or the wind blow when we need electricity. Industry analysis suggests every megawatt of intermittent renewables may require half as much of reliable back-up generation. Batteries may be the solution in time as obstacles around scale production are resolved, as well as hydrogen-generated power, but in the meantime gas can be the go-to back-up power solution.
The grid transmission business will benefit from investment required to stabilise the grid and transport distributed energy to consumers. To provide some context to the scale of grid investment required, Siemens Energy themselves referenced in one of their own recent podcasts that it took 150 years to build the grid to where we are now, and we will need to double it in the next 15 years and again in the following 15 years. Finally, the company is also investing in next generation solutions around electrolysers and hydrogen power generation.
Siemens Energy is priced at around 5x our estimated 2025 EV/EBITA with multiple positive catalysts given the favourable policy backdrop afforded by the US Inflation Reduction Act and Europe’s legislative response progressing.
In the next episode on our podcast, we’ll have an interview with Siemens Energy CEO, Dr Christian Bruch. It’ll be released in the coming week. You can subscribe on Spotify, Apple or Google to be notified.
By the Antipodes Investment Team